Dr. Jasper J. Goedbloed,
Senior
Member
Philips Research Laboratories
Eindhoven, The Netherlands
The model used by Laik and Boizard [1] to establish the uncertainty budget of a radiated emission measurement has deficiencies since important parameters (influence quantities) are not taken into account. Therefore, that model is not applicable to a standardized compliance test such as CISPR 22 (or EN55022). In this paper, some of the deficiencies, also present in [2, 3], will be considered. In addition, some ongoing work on standards compliance uncertainty will be mentioned.
The radiated emission compliance test is based on the determination of an emission level. Chapter 161 of the IEV (International Electrotechnical Vocab-ulary), a mandatory document in CISPR22, defines the emission level as "the level of a given EM disturbance emitted from a particular device, equipment or system, measured in a specified way". Consequently, all relevant influence quantities associated with the test should be taken into account and not only those limited to the measurement instrumentation, as in [1], Table 2. Moreover, Refs. [1-3] tacitly and incorrectly assume that all sensitivity coefficients giving the relation between the uncertainty in an influence quantity and its effect in the uncertainty budget are equal to 1.
By using the relation E=kVP(1+D), Ref.[1] essentially assumes that a radiated emission measurement is only a voltage measurement (E is the field strength, k the antenna factor (AF), V the voltage reading (U), P the cable loss (Ac) and D the mismatch uncertainty). The test however requires the measurement of the field strength at a certain distance d from the EUT, while the EUT is at a height ht above a reflecting metal plane having an effective reflection coefficient r = r.exp(jj), using a specified lay-out of the EUT and its cables. In addition, at the measurement frequency a scan of the height h of the receiving antenna (1m to 4 m) plus a 360° rotation of the EUT set-up is required to find the maximum Emax of the emission. Of course, these influence quantities are nearly all geometrically instead of electrically specified. However, that does not mean that they can be excluded from the uncertainty budget.
It is instructive to calculate the maximum field strength Ec,max at the center of the receiving antenna by using geometric optics and assuming that the EUT is a point source in the far-field:
|
(1)
In Eq.(1), K is a factor proportional to the square root of the power emitted by the EUT in the azimuth direction f and the elevation direction J= arctan(d/(h–ht), Dd= Ö{d2+(h-ht)2} is the direct distance between the point source and the center of the receiving antenna and Dr= Ö{d2+(h+ht)2} that via reflection to the metal plane, s = Dd–Dr, b = 2p/l and l is the wavelength. The equation illustrates how geometrically specified influence quantities may enter into a model.
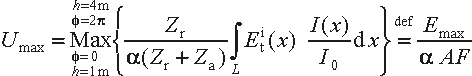
The voltage Ui induced in the receiving antenna follows from the integral over all antenna elements of the incident field tangential to these elements (described by an expression comparable with Eq.(1)), weighted by the current distribution over these elements in the transmitting state of the antenna [4]. The measured voltage U= ZrUi/{a(Zr+Za)}, where Zr is the input impedance of the receiver, Za the antenna impedance, and a a factor determined by the antenna cable loss Ac, mismatch, etc., so that
 |
(2)
or Emax = a.AF.Umax; see under 'Discussion' below. The form of the latter equation is identical to that used in [1], but Eq.(2) takes important specified influence quantities into account that were neglected in [1-3].
Unfortunately, geometrical optics fails in taking important mutual couplings into account. As is well known from antenna calibration and site validation measurements, several mutual couplings play a part in the actual model predicting Umax. In such a model, the EUT can be represented by an effective ThŽvenin source inside that EUT, supplying its signal to an effective antenna formed by e.g. the printing wiring board, the chassis and the connected cables. So the EUT (including its antenna) is fully comparable with the transmitting antenna (including its source) in, for example, an antenna calibration. Similarly, the EUT has its mirror source in the reflecting plane and the receiving antenna (including its load impedance) has its mirror too.
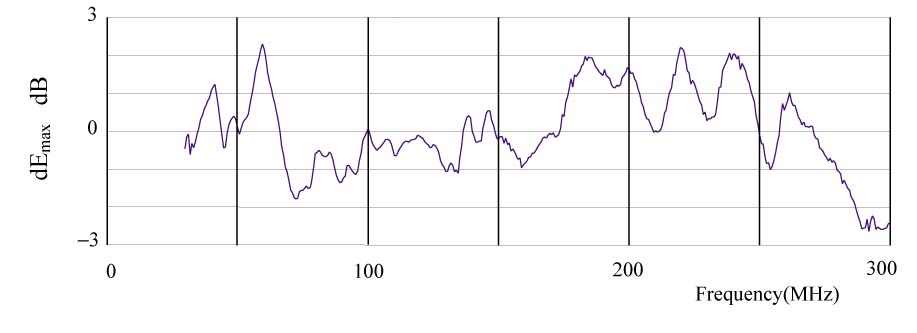 |
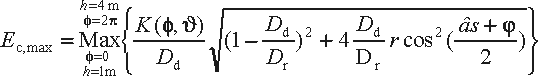
Figure 1: Measured field strength difference dEmax (dB) after a biconical antenna has been replaced by a log-biconical antenna |
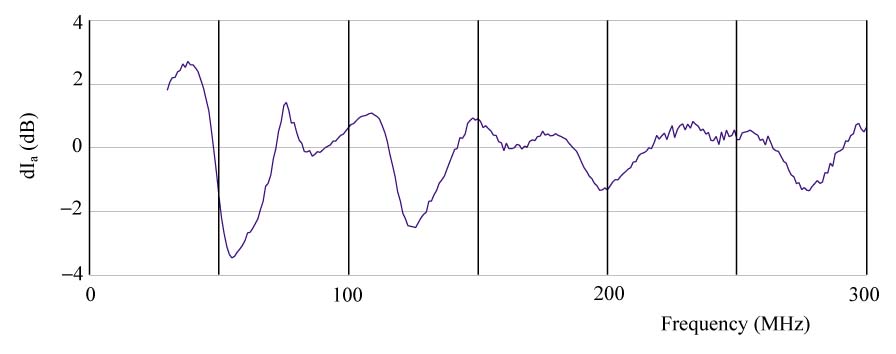 |
Figure 2: EUT1 feed-point current difference dIa (dB) after the EUT1 height above the reflecting plane has been changed from 10 cm to 80 cm. |
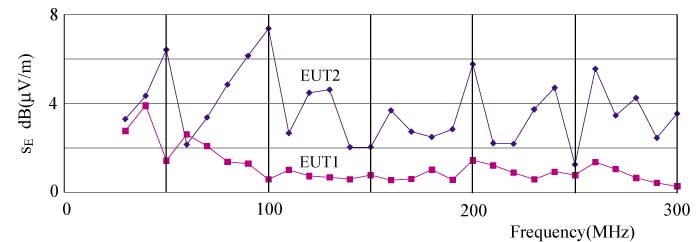 |
Figure 3: Preliminary RRT results: Standard deviation of Emax for EUT1 and EUT2 |
Next, a model can be constructed consisting of a 4-port network in which the various mutual couplings are represented by the impedances in that network [5]. The impedances depend on the dimensions, shape and mutual orientation of both antennas and on the distances between the antennas and the reflecting plane (location of the mirror devices). Of course, there is no simple method (if at all) for calculating these impedances for an actual radiated emission test configuration. However, that does not change the physics of the problem and the need to address the mutual couplings in uncertainty considerations.
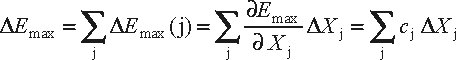
The uncertainty DEmax in Emax resulting from the uncertainties DXj in the n (j=1,...,n) influence quantities Xj follows from
 |
(3)
where cj = ¶Emax/¶Xj is the jth sensitivity coefficient. In general, cją 1.
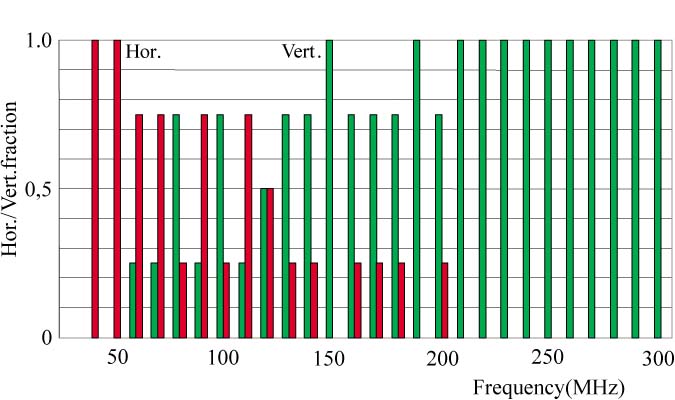 |
Figure 4: Preliminary RRT results: horizontal/vertical polarization fraction associated with Emax. |
The difficulties associated with the actual modeling and the estimation of parameter values made CISPR/A decide to start a radiated emission Round Robin Test (RRT) [6]. In such a test quantitative and statistical information is collected relating to the important influence quantities and their uncertainties. In the RRT, 14 qualified EMC test houses in the EU, Switzerland and the USA will perform well-specified emission measurements using two EUTs, various types of antenna and sites (OATS, SAR, FAR) with test distances 3m and 10m.
EUT1 is a tightly specified, electrically long monopole antenna (rod antenna on a small ground plane), driven by a battery-operated comb generator. The rationale to use this EUT, which resembles a battery-operated digital equipment with one connected cable, can be found in [7]. The current close to the feed point of the rod antenna is measured via a clamp-on probe and an optical link. This current is comparable with the common-mode current in the mentioned cable. The rod is positioned vertically. In the emission measurement the receiving antenna is used only in vertical polarization but a height scan is included. EUT1 is not rotated. EUT1 is a calculable device, which means that the outcome of the experiments can be verified and a parameter sensitivity analysis can be performed.
EUT2 consists of three boxes interconnected via two-wire cables, while two of the boxes are connected to the mains. EUT2 represents a kind of 'computer' system consisting of a computer (comb generator), a printer (metal box) and a mouse (metal box). Its emissions are to be measured in full accordance with CISPR22, including rotation of EUT2 and the measurement of the horizontally and vertically polarized field components.
The 'GUM' theory [8] used in [1] for the calculation of the standard uncertainty assumes that all DEmax(j)/Emax are small and of the same order of magnitude. If a large relative variation plays a part (see below) additional considerations may be necessary. Furthermore, from Eq.(1) it is directly clear that it will not be possible to write Emax dB(mV/m) as a sum of terms in dB units, where each term accounts for only one influence quantity. Therefore, the 'root-sum-square' approach with dB units, used in [1] to calculate the standard uncertainty, is not automatically valid as it assumes a full linear relation. Ref. [1] gets around this problem by writing D dB in stead of (1+D) dB. Moreover, it is not possible to deal with the measurement equipment uncertainties separately [7, 10].
The right-hand side of Eq.(2) has been obtained 'by definition' as the radiated emission test asks for Emax= a.AF.Umax, where AF is the antenna factor of the receiving antenna as determined in the chosen calibration procedure. This factor does not only depend via Za on the height h of the antenna above the reflecting plane (as mentioned in [1]) but also on the mutual coupling with the EUT and its mirror, and(!) on the radiation pattern of that EUT (entering via the integral in Eq.(2)). If the radiation pattern in the compliance test differs from that during calibration, which is very likely, the integral will yield a different result.
As an example, Fig. 1 shows the difference dEmax when in a RRT/EUT1 measurement only a biconical antenna is replaced by a log-biconal antenna. Now part of dEmax may result from the fact that the antennas integrate over different parts of the field distribution. Moreover, the height hmax at which Emax is found in the compliance test and hmax in the antenna calibration need not be identical. Therefore, DZa(h) is not directly known, even in absence of a mutual coupling with the EUT. See also an 'old' paper by Dvorak [9] that is still very relevant today.
As a second example, Fig.2 shows the change dIa in the EUT1 feed-point current when only the height ht of EUT1 above the reflecting plane is changed from the standardized height of 10 cm (floor-standing equipment) to 80 cm (table-top equipment). This graph shows that the radiating properties of EUT1 also change. The effect is caused predominantly by the change in the mutual coupling between EUT1 and its mirror, causing a change in the load impedance of the mentioned Thévenin source. Consequently, the associated variation of Emax cannot be fully explained by geometric optics. Of course, the uncertainty in ht will never be as large as (80-10)= 70 cm, but the effect shown in Fig.2 demonstrates that mutual couplings should be addressed in uncertainty considerations.
An important contribution to DEmax stems from the uncertainty in the antenna properties of the EUT, in particular as a result of the variation in cable lay-out allowed by the emission standard. In Eq.(1) this would become evident in an uncertainty in K. As an illustration, Fig.3 shows the standard deviation sE of Emax resulting from the first four available RRT results. The deviation associated with the tightly specified EUT1 is clearly less than that associated with EUT2 where the cable layout has a relatively large tolerance. The somewhat larger sE values of EUT1 at the lower frequencies can be attributed to site imperfections known from the reported NSA data.
The larger EUT2 sE values can be attributed to variations in the radiation pattern of EUT2 and to variations in the resonance frequencies of the 'EUT2 antenna' comparable with those of an actual antenna [7]. The latter also explains why the sE relating to an open-area test site hardly differs from that relating to a fully anechoic room (FAR), as regretted by those promoting a FAR to reduce DEmax. It has to be investigated whether this relatively large contribution to DEmax allows the application of the 'small-signal' GUM theory.
CISPR22 requires the measurement of the horizontal and vertical components of the field, but only the larger of these two components is to be reported. As a last example, Fig.4 shows that the variability of the cable layout also results in a variation in the horizontal and vertical components yielding Emax. At several frequencies the polarization is not unanimously found.
Some metrology-oriented experts are of the opinion that the variations caused by the variability in the cable layout do not contribute to DEmax. They consider these variations to be a reproducibility problem. Such a view is allowed, but the result of their DEmax cannot be used in the compliance criterion since, as said before, the compliance test requires the determination of the emission level measured in a specified way. That specified way includes the specifications of the cable layout and, hence, its variability. Alternative formulations of the compliance criterion may be found in [7, 10]. Finally, the metrology-based uncertainty considerations refer to a 95% confidence level. It is not known how that level is to be reached when a compliance test is carried out only once.
If everything proceeds according to plan, the actual RRT measurements will be finished by spring 2001. The analysis of the data has already been started and the first results will be discussed at the 2001 CISPR/A meeting and presented at an EMC conference as soon as possible. In addition to the measurements, numerical calculations (NEC-like calculations) have been started to describe the EUT1 measurements. CISPR/A now uses the results of uncertainty considerations to improve emission standards [11].
At present, UKAS is rewriting NIS81 [2] as quoted in [1]. In the new version attention is being paid to improved modeling and to uncertainty contributions from non-specified influence quantities (in the electrical sense) such as cable layout effects [12].
[1] Radio Disturbance Measurement and its Uncertainties, S. Laik and J.L. Boizard, IEEE EMC Society Newsletter, 185, spring 2000, pp 13-15.
[2] The treatment of uncertainty in EMC measurements, NAMAS Publ. NIS81, May 1994.
[3] Accounting for measurement uncertainties when determining compliance with a limit, CISPR/A/CD/256, December 1999.
[4] Antenna theory, C.A. Balanis, Harper & Row, New York, 1982
[5] High-frequency models in antenna investigations, G.H. Brown and R. King, Proc.IRE, 22, 4, pp 457-480, 1934.
[6] CISPR/A Radiated Emission Round Robin Test, Convenor Dr. P. Beeckman, Philips Research Laboratories, Eindhoven, The Netherlands.
[7] Uncertainties in standardized EMC compliance tests, J.J. Goedbloed, EMC Symposium, Zurich, 1999, Suppl. pp 161-178.
[8] Guide to the expression of uncertainty in measurement (GUM), ISO, Geneva, 1995.
[9] Are antenna factors valid in EMC measurements?, T.J. Dvorak, Int. Symp.on EMC, Nagoya, 1989, pp 587-590.
[10] Uncertainties in CISPR compliance testing, Part 1: General and basic considerations, CISPR/A/CD 272, May 2000.
[11] Uncertainties in CISPR compliance testing, Part 2: Voltage measurements, CISPR/A/CD273, May 2000.
[12] Private communication, M.J. Alexander, NPL, UK.
 |
From 1978 until 1997, when he retired, Jasper J. Goedbloed was a Supervisor and Senior Scientist with the EMC Department of Philips Research Laboratories. He contributed to the work of IEC/TC77, e.g. by writing IEC 1000-1-1 'Application and Interpretation of Fundamental Definitions and Terms', and to the EMC Working Group of the ZVEI (Germany), in particular to the statistical investigations (transients on the mains, EMI properties of telephone-subscriber lines). Until his retirement he chaired IEC/CISPR/A WG2 and is still active in the field of uncertainties in standardised EMC compliance testing. Mr. Goedbloed can be reached via e-mail at jjg@iae.nl