|
Electromagnetic Compatibility Research at NIST, Boulder |
|
1. Introduction In the early 1950s, the National Bureau of Standards (now the National Institute of Standards and Technology, or NIST) determined that it needed a remote field site, away from their Washington DC laboratories, for radio-frequency (RF) propagation and measurement studies. Boulder, Colorado was chosen over several contenders as the new laboratory site. Boulder, at that time, offered (a) a relatively quiet radio-frequency electromagnetic environment, which enabled more accurate measurements and experiments, (b) a varied geographic terrain, which facilitated the study of radio propagation, (c) the presence of a major university (the University of Colorado, CU), and (d) proximity to a large city (Denver). The new Radio Building was completed in 1953 and dedicated by President Eisenhower in 1954, as shown in Figure 1. The technical mission of the NIST (NBS) Boulder laboratory was to develop the most accurate reference standards and calibration services possible to ensure compatibility of the emerging radio, microwave, and radar technologies that the nation was then developing. NBS (NIST) was part of a Boulder scientific community, which included the National Oceanic and Atmospheric Administration (NOAA), the Institute for Telecommunication Sciences (ITS), the Cooperative Institute for Research in Environmental Sciences (CIRES), CU Boulder, the National Center for Atmospheric Research (NCAR), and other laboratories. Research on radio propagation was fundamental to this work, and as higher frequencies were explored, the interactions between electromagnetic waves and the atmosphere led to new directions of research. NIST research on accurate measurement systems and the development of standards and calibration services play an essential role in making possible many of the RF technologies that we now use daily. This article presents a brief overview describing the development of electromagnetic compatibility (EMC) test methods at the NIST Boulder laboratories. We will highlight both key research areas and some of the key contributors. The restricted length of the article does not allow for all topics, contributors, and references to be mentioned, and the authors apologize for any and all inadvertent omissions. In addition, while we cite references arising from NIST work, references cited cover only a small part of the overall work in the various technical programs. We again regret that a more inclusive set of references cannot be given. A list of contacts by research area is given in the paper. These individuals can be contacted to obtain more information. 2. Early NIST EMC Pioneers The area of EMC at NIST, Boulder was first given impetus by Frank Green around 1968. His team instigated the standard antenna method on a flat earthen surface for both E-field and H-field measurements. By use of equations from R.W. Beatty, a horn antenna gain technique was also developed. In the early 1970s, horn antenna gain was measured by pointing the transmitting horn up toward space. This resulted in a hemispherical free-space facility. The two antennas were mounted on a rail system attached to a telephone pole and measured using extrapolation methods. See Figure 2. This was the "initial" EMC test facility at NIST Boulder. In the subsequent years other facilities were developed, including an open-area test site (OATS), anechoic chambers, transverse electromagnetic cells (TEM cells), reverberation chambers, and time-domain ranges. Central to the use of these facilities was the development of accurate field probes and antenna calibration techniques. These facilities and the probe work will be briefly outlined in the following sections. 3. OATS The NIST Boulder OATS has dimensions of 30.5 m by 61.0 m. The construction is a 6.4 mm wire mesh (1/4") stretched over a concrete pad with stainless steel sheets at the center measuring 10 m by 20 m. The mesh is grounded around the perimeter. A concrete tunnel underneath the pad leads to an equipment and measurement room. Ducts in the pad allow cables to be routed from the measurement room to various locations on the OATS. Figure 3 shows a mid-1970s probe measurement at the first NIST Boulder OATS. Our OATS is presently used primarily for calibration of reference antennas and for emission studies; however, numerous topics have been addressed in the past as the standardization of OATS methods was developed. One of the key OATS tests is site attenuation. Site attenuation measurements, while conceptually simple, require a good site and careful measurement practice [1-5]. Richard Fitzgerrel, along with Ezra Larsen, Jose Cruz, and John Workman, played a leading role in refining this test. In particular, the antenna characteristics (gain, pattern) are affected by its proximity to the ground plane [6]. The size of the ground plane is also important [7]. NIST has also analyzed the uncertainties present when calibrating reference antennas at OATS [8-9]. Repeatability also depends on the measurement methodology used, as well as the site characteristics. NIST is working toward improving repeatability via industrial and international intercomparisons [10]. These efforts highlight the need for reference emitters and antennas. Weather can limit the use of an OATS. Thus, "low-reflecting" structures are often used to protect equipment and the equipment under test (EUT). These can be equipment sheds or complete OATS covers. Measuring the effect of these structures on measurement accuracy is an important and difficult task. NIST pioneered the use of time-domain techniques to separate out the contribution of the weather structure [11]. Measurements on a fiberglass structure show that emissions testing can be significantly affected at frequencies above 100 MHz. At one point in the mid 1980s, the Boulder OATS was covered with an inflatable bubble to make it an all season site. However, one of Boulder's notorious Chinook winds (100+ mph) proved too much for the bubble and the OATS was soon transformed back to a true open site. Figure 4 shows a time domain cone antenna installed under the bubble prior to its unfortunate demise. OATS facilities are recognized as standard sites for EMC measurements. Increased ambient noise and the need to test at higher frequencies will place new challenges on OATS measurements. NIST is working on methods to improve repeatability and accuracy to meet these challenges. The primary areas for current and future research are:
Toward these goals the NIST OATS has been refurbished. Improvements include a solid steel sheet center, conductive caulking of joints, better ground contact at the edges, and additional weatherproofing. These improvements resulted in site attenuation values within +/- 2 dB of prediction. Moment-method calculations are being used to calculate the effective length and input impedance of NIST standard dipoles to further improve the comparison between measured and predicted site attenuation. NIST continues to collaborate closely with the U.S. industrial community through participation in standards and industry groups, such as ANSI C63 (American National Standards Institute) and USCEL (U.S. Council of Electromagnetic Laboratories). Contact: Dennis Camell (303-497-3214, camell@boulder.nist.gov) 4. Anechoic Chamber The NIST Boulder anechoic chamber is a shielded fully anechoic chamber of dimensions 8.5 m by 6.7 m by 4.9 m. The pyramidal absorbers used throughout are 90 cm (36") in length, except in corners and on the transmit antenna wall, where 60 cm (24") cones are used. The lower-frequency limit for typical use is approximately 300 MHz. A precision 6-axis automated positioner within the chamber is used to orient the test antenna as needed. Originally, the lab where the anechoic chamber is presently located was used for microwave measurements of the speed of light. NIST presently uses the fully anechoic chamber for probe calibrations, standard antenna measurements, general EMC measurements, and research. Figure 5 shows a probe calibration in an earlier NIST Boulder anechoic chamber, prior to refurbishment. Absorber characterization is basic to the design and performance of anechoic chambers. NIST has been active in characterizing absorber, both theoretically and using in-situ measurements [12-36]. Simulations are very important in the design stage since they allow absorber performance to be optimized as a function of size, shape, bandwidth, angle of incidence, polarization, material properties, layer thickness, number of layers, and so forth, as needed for a particular application. Ideal plane layered absorber, such as ferrite tiles, is straightforward to analyze. In practice, installed ferrite tiles may have gaps between them which can affect performance [12, 26]. Shaped absorber poses a more difficult problem. At higher frequencies, when the wavelength is small compared with the absorber dimensions, geometric optics and ray-tracing techniques may be used. At lower frequencies, when the absorber dimensions are small when compared to the wavelength, a homogenization approach may be used [13-18]. In effect, the air and absorber media are "averaged" as a function of their relative volume fill along the taper direction. The result is effective bulk parameters (generally anisotropic) for an equivalent transversely uniform medium. An excellent review of the homogenization technique and its application to a variety of tapered and hybrid absorber is given in [17]. Direct absorber measurements, using conventional CW far-field scattering, are made difficult by the size of the absorber. Typical tapered cones have lengths along the taper direction of 30 cm to 2 m. At relatively high frequencies, dual directive antennas, one transmitting and one receiving, may be used. However, this method suffers from direct path coupling between the antennas and is generally not appropriate for the usual 30 to 1000 MHz EMC measurement range. An alternative approach is to use some form of coaxial or rectangular waveguide. These work well over a limited frequency range but determine only normal-incidence reflectivity. This underscores the need for simulations and alternative in-situ measurement techniques. NIST has worked to overcome the difficulties inherent in conventional CW free-space and coaxial waveguide systems through the development of two free-space measurement systems. The first technique consists of placing a free-space reflectometer, consisting of either one or two TEM horn antennas, inside an anechoic chamber and measuring the performance of the installed absorber system in-situ. An efficient sequence of positioning the system and signal processing yields either oblique or normal absorber reflectivity characteristics for a selected area of absorber over the frequency range of 30 to 1000 MHz. A second technique consists of placing a sample of absorber, typically with dimensions of 2 m x 2 m or greater, on a moveable Styrofoam support structure, as shown in Figure 6. The sample is moved into close proximity to a fixed, free-space reflectometer system, consisting of either one TEM horn antenna for normal-incidence characteristics, or two TEM horn antennas to evaluate either oblique incidence or cross-polarized performance. The effects of the small sample are ameliorated by time-gating out the small-sample edge diffraction, yielding accurate reflectivity results from 30 to 1000 MHz. The realization and results obtained with these systems are discussed in [19-26]. Fully anechoic chambers, such as the NIST Boulder chamber, are used for generating standard fields for probe and antenna calibrations [27]. The accuracy requirements may require a more careful chamber evaluation than is required for the EMC standards measurements [28-29]. The field distribution is one metric [30-31] including both on- and off-axis values [32]. The field distribution over a specified volume can be controlled using a near-field array [33] rather than a single antenna. Measuring the transmission loss and comparing it to an ideal free space is another approach [34-35]. Time-domain methods have also been investigated [24-26, 36-37]. Another important issue is resonances that may be insufficiently damped by the absorber. Detection of resonances in an anechoic chamber is difficult if direct field coupling between two antennas largely masks the resonance perturbation. The matrix pencil method is being explored as a means of extracting the contribution of resonances [38-39]. A common thread between the anechoic chamber
and OATS research was the development of the standard dipole, which
is now used worldwide. R. Fitzgerrel was instrumental in the development
of the standard dipole.
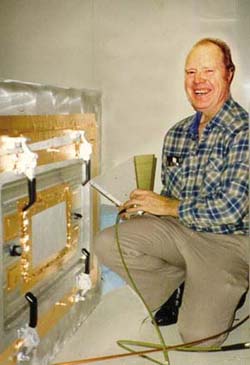
We continue to upgrade equipment and software used at our anechoic chamber in order to achieve these goals. We continue work on numerical models for simulating absorber and chamber performance. We are also participating in standards groups, such as ANSI C63 and CISPRA, to support their efforts in these areas. Contact: Chris Holloway (303-497-6184, holloway@boulder.nist.gov) 5. TEM Cell NIST has several TEM cells with cross-section heights ranging from a few cm to 3 m. Myron Crawford initiated much of the work on TEM cells at NIST and popularized their use for EMC applications. Figure 7 shows "Mike" squatting next to the NIST 3 m TEM cell. Some authors still refer to TEM cells as "Crawford Cells". Other early NIST contributors were Ezra Larsen, Mark Ma, Moto Kanda, and John Workman. The initial application for TEM cells was to generate a uniform electromagnetic field for probe calibration at frequencies below typical anechoic chamber capabilities [40]. As TEM cell usage matured, broader EMC applications emerged, such as emission and immunity testing, source characterization, shielding effectiveness, and even bioelectromagnetics applications. The first step was to characterize the basic transmission line and waveguide properties, and here NIST played an important role. TEM cells consist typically of a section of rectangular coaxial transmission line (RCTL) tapered at each end to 50 ý connectors. This cross section does not lend itself to a simple analysis, as is the case with circular coaxial cable. Thus, one of the first TEM cell related problems considered was the transmission line properties of a RCTL of uniform cross section. In particular, the field distribution of the TEM mode and the characteristic impedance of the RCTL were of interest. The TEM-mode field distribution determines the uniform area in the cell. The field distribution in a cell can be determined directly via measurements [41]; however, the design of a TEM cell requires analytical and/or numerical solutions. Excitation of the cell by an ideal point source is one method of analyzing the field distribution [42-43] and also provides a comparison to measurement. The TEM-mode field distribution may also be directly analyzed. Solution methods include conformal mappings [44], integral equation methods [45-46], moment-method solutions, and other approximations [47]. In addition, numerous numerical approaches have been applied. This work developed guidelines for the construction of TEM cells [48] and the conversion of shielded enclosures to TEM cells [49]. During this initial phase of TEM cell research, NIST had a close cooperation with the University of Colorado in Boulder and was greatly assisted by David Chang, John Tippet, I. Sreenivasiah, and others. Higher-order modes perturb the intended TEM-mode field distribution. In many types of cells the cutoff frequency for the initial higher-order mode determines the upper limit of the cell's usable frequency range. The cutoff frequency of a higher-order mode is inversely proportional to the size of the RCTL. Thus, larger TEM cells have lower cutoff frequencies. This limits the usage of TEM cells for large test objects. NIST investigated higher-order modes using various analytical approaches [50-54], reflecting the limited computing power available at the time. Current researchers are taking advantage of numerical tools to consider the structure of whole TEM cells, including tapers. Characteristics of TEM cells, such as the field distribution and the characteristic impedance, are typically defined for an empty cell. Introducing a test object will influence these characteristics [55-58]. The papers investigate mostly the perturbation in the TEM-mode field structure due to the test object presence. A rule of thumb developed from this work is to limit the test object's size to less than one-third of the test volume's height [59]. This consideration is based on avoiding significant perturbations to the induced currents on the EUT (when compared to free space) and the input impedance into the cell [57-58]. Some TEM cell loading is intentional. As noted, higher-order modes limit TEM cell usage. Absorber can be used to damp the resonance effect of these modes and thereby extend the usable frequency range of a cell [60-62]. However, the presence of the absorbing material near the test volume may perturb the intended TEM mode field distribution. An alternate form of loading is to vary the end termination impedance. Typically, a 50 ý termination is used to match the RCTL impedance and avoid reflections. However, reflections can also be used intentionally to control the wave impedance and simulate near field conditions [63]. Generating a known TEM-mode field distribution in a TEM cell is useful for testing the immunity of an EUT. Conversely, allowing an EUT to radiate and couple to the TEM mode gives information as to the emissions from the EUT. Various approaches to analyzing EUT emissions have been developed. The approach considered at NIST was to model the EUT as a set of multipole moments [40, 64-76]. A sequence of EUT orientations is used to determine the coefficients of the multipole moments. Usually the electric and magnetic dipole moments are determined, which limits the EUT type to electrically small objects. However, quadrupole and higher moments may be determined at the expense of a significantly more complicated measurement sequence. Monopole radiation models were also developed [46]. Measurement errors and uncertainties due to positioning are also important. The multipole moment coefficients depend on the location within the EUT volume chosen for the multipole expansion. If all the multipole moment coefficients are determined then the expansion location is arbitrary. However, if the expansion is truncated, typically the case for TEM cell measurements, then any deviation of the assumed expansion location and the actual source location will cause errors [72]. The TEM cell is a widely accepted EMC/EMI test method. NIST regularly uses TEM cells to calibrate probes and for characterizing emissions from electrically small objects. A number of areas need further work. The higher-order mode behavior in flared TEM cells and their interaction with broadband terminations needs examination. Correlating TEM cell immunity and emission measurements under conditions more general than for electrically small objects would further expand usage. Devising a scheme to extract phase data from single-port TEM cells would reduce possible phase-related errors. TEM cells are useful for measuring EUT total radiated power at lower frequencies. There is a need to relate total radiated power to maximum field level statistics in typical EUT application environments to assess the EMC/EMI threat. This question applies to the reverberation chamber as well. Areas for current and future research are:
We are actively participating in the IEC Joint Task Force on TEM cells which is developing an independent standard covering emission, immunity, and pulse testing in TEM cells. We also continue to explore methods to reduce the uncertainty of probe calibrations in TEM cells. Contact: Perry Wilson (303-497-3406, pfw@boulder.nist.gov)
6. Reverberation Chamber The primary NIST reverberation chamber has dimensions 2.74 m x 3.05 m x 4.57 m. The construction is welded cold-rolled steel. NIST uses reverberation chambers for testing large EUTs, generating high field levels, and shielding studies. NIST has been active in developing the statistical methods necessary to characterize reverberation chambers and in developing standard measurement methods. Good overviews of NIST research on reverberation chambers are given in [77-78]. Myron Crawford, along with Mark Ma, gave initial impetus to work on reverberation chambers within NIST. The University of Colorado again supported NIST, with contributions from I. Sreenivasiah, Bing-Hope Lui, Doris Wu, and David Chang. Some of the key issues studied include basic design, mode density, the quality factor (Q-factor), field uniformity statistics, variable-boundary-condition performance (paddle mixing), electronic stirring, spatial correlation, EUT directivity, and hybrid TEM/reverberating chambers. Some important applications are immunity measurements, shielding effectiveness measurements of cables and connectors, and total radiated power measurements. One of the first applications of the reverberation chamber was tests on military equipment at high field levels, as shown in Figure 8. The modal spectral distribution and bandwidths of a chamber are important design considerations. The larger the number of modes in a reverberation chamber, the better the effective density of plane waves coupled to the EUT. The number of modes increases with frequency in a monotonic fashion. NIST investigated approximations for the number of modes in a cavity as an alternative to computing and counting them [79]. The distribution of the modes over frequency is another important quantity. Ideally, the modes are uniformly distributed within the operating bandwidth. This suggests that degenerate modes (i.e., modes with the same resonant frequency) should be avoided. For this reason the NIST reverberation chamber was designed with unequal dimensions that do not yield easy integer ratios. Mode density may be estimated by differentiating the mode number approximation. If we use 1 mode per MHz as a reasonable lower mode density criterion and use the NIST chamber dimensions above, we find a lower usage frequency of approximately 170 MHz. Field uniformity measurements in the NIST chamber show that performance is good above about 200 MHz which agrees well with this estimate [80-81]. The Q-factor is a measure of the energy stored versus the energy lost in the chamber. At high frequencies oss occurs primarily in the chamber walls due to non perfect conductors while at lower frequencies the antennas account for most of the energy absorption. The Q-factor of an individual mode is readily determined. However, defining an effective Q-factor for the chamber when multiple modes are present is less straightforward [82-84]. NIST investigated approximations for the effective Q-factor. The quality factor is an important design quantity that must be balanced between the need for low conductor losses (high Q) and broad modal coverage (low Q). EUT loading will reduce the Q during actual tests. However, introducing absorbing material into a chamber to reduce the Q may be desirable at times. Time-domain methods may also be used to determine the effective Q of a chamber [85-86]. The basic approach is to ring-up the chamber with a pulsed signal and then use the decay time to determine the effective Q. This method can be used to quickly determine the loading effect of an EUT or paddle. A primary measure of reverberation chamber performance is the field uniformity [80-81, 87-96]. Ideally, the field will have the same statistical behavior regardless of location in the measurement volume. This implies that the variable boundary condition, due to the presence of a mode-stirrer, is sufficient to create over a rotation a dense set of equivalent plane-wave orientations at all points in the measurement volume [96-101]. Spatial correlation is also an important measure of chamber performance [102-103]. One measure is the correlation between points within the measurement volume. Another is how quickly points become reasonably uncorrelated as a function of the distance to the fixed boundary conditions at the walls. This determines the size of the usable measurement volume. In addition to field at a point (polarization, strength), the voltage standing wave ratio (VSWR) and the net input power into the chamber are monitored. As mentioned above, one or more paddles rotating about an axis are usually used as the variable boundary condition. The paddles need to be electrically large, and they typically have some bends or flaps to further randomize the field. Two measurement methods are typically used, mode-stirred and mode-tuned. In the mode-stirred case, paddles are turned continuously and the field is sampled at a rate much higher than the rotational frequency. In the mode-tuned case, paddles are stepped in discrete intervals and the parameters of interest (e.g., VSWR, net input power, test-object response) are measured between steps. The latter method allows the field strength to be corrected as a function of VSWR. A third method is to electronically stir modes by varying the bandwidth of the input signal [104-105]. As the bandwidth of excitation is increased, the number of modes increases and the statistical behavior of the fields improves. The maximum response versus frequency of a test object may be determined via measurments in a reverberation chamber. However, because only the overall field statistics are known, the direction of maximum response and the gain of the test object are not determined. Similarly, in the emissions case the total radiated power from the test object may be determined, but not the antenna pattern. NIST is currently investigating methods for statistically estimating the directive characteristics of a test object based on the electrical size of the test object and the measured total radiated power [106-107]. Directivity is a key link between measurements in a reverberation chamber and by other methods, such as in an anechoic chamber [108]. The directivity of unintentional radiators is expected to become more important as EMC test methods move to frequencies above 1 GHz and most objects tested are electrically large. Due to the need for sufficient mode density in the cavity, the reverberation chamber is a high-frequency method. The TEM cell is a low-frequency method because the TEM mode on a transmission line has no cutoff frequency. NIST has worked to combine these two methods to create an extremely broadband test facility [109-113], although a transition region between the two regimes exist where the test field may not be acceptable. One advantage of such a hybrid is that very high field levels (> 200 V/m) can be achieved with modest input power. The relatively high Q of the reverberation chamber means that high field levels are possible with moderate input power. Most EMC susceptibility testing requires modest fields levels on the order of 10 V/m or less. For most test objects these levels may be readily realized in anechoic chambers and TEM cells. However, some EMC testing (e.g., military, aerospace) requires testing to significantly higher field levels, on the order of 200 V/m or more. This can pose a problem for users of anechoic chambers due to expensive amplifier power needs and a possible fire risk for anechoic materials. Thus, the reverberation chamber has found wide application in the area of testing at high field levels [81,87,89,91,94]. High field levels also create a large dynamic range. This has found application to shielding effectiveness measurements of cables, connectors, and gaskets [114-126]. Gaskets are often measured by use of nested reverberation chambers. A small cavity with an internal paddle is placed inside a larger reverberation chamber. Coupling is then accomplished primarily through a large aperture that can be covered with a gasketed plate or a test material. An alternative under consideration is to use two large reverberation chambers placed side by side with a large coupling aperture. This would allow the testing of very large gasketed openings such as doors and large access panels. There are many technical opportunities for future research in reverberation chambers and related technology. NIST is currently looking into:
Contact: Galen Koepke (303-497-5766, koepke@boulder.nist.gov)
7. Time-Domain Range A state-of-the-art cone and ground-plane range is currently being constructed at the NIST Boulder laboratories, and is scheduled for completion later this year. The range consists of a precision fabricated 7.4 m x 7.4 m aluminum ground plane with a flatness specification of ±0.1 mm. The cone height will be 4 m with a total angle of 4º forming a 200 ý system. This facility will be used to generate a precision field that can be used to calibrate a wide variety of devices: D-dot sensors [127], microwave and UHF antennas, and some types of EMC antennas. In addition, this facility will be used to conduct scattering measurements and as a test bed for developing new techniques for qualifying EMC measurement facilities. Figure 9 shows an early cone and ground screen. Our work on time-domain measurement began in the early 1960s. There was a need in the military to measure the peak RF power of a microwave radar pulse. Paul Hudson recommended that we measure not only the peak power but also the entire power characteristic of the pulse, as a function of time. Warner Ecklund, a graduate student working at NBS at the time, suggested that we build a fast diode switch that could sample the RF signal at any given position within the pulse. We measured the power in the sample using a thermal detector (the same thermocouple devices still in use in the RF voltage calibration facility) and compared the measured value to a similar sample taken from a continuous-wave (CW) RF source. We had the primary standards to measure CW power at that time, so this was a natural step forward for us. This work began in the radar band between 950 MHz and 1250 MHz. Ecklund built the first switch using the fastest switching diode available at that time, the 1N4153. It had a switching speed of about 10 ns, and provided clean switching characteristics for sampling applications. To obtain 60 dB of isolation, Ecklund used six diodes in series forming the center conductor of a coaxial transmission line. Since the diodes had significant reactive impedance at the radar frequencies, he added a capacitive tuning stub at the connection between each pair of diodes. In this way, he was able to reduce the VSWR of the switch to a very reasonable amount. The effort was very successful and launched our time-domain work. This became the reference standard for a peak-power calibration service developed later by Phil Simpson and Lee Saulsbury. Later in the 1960s, Norris Nahman joined our staff and began our first serious effort in very-high-speed time domain measurement. The focus was on picosecond-duration pulses. He was supported by Chuck Manney, Bill McCaa, and Jim Andrews (who later founded Picosecond Pulse Labs). Still later, Sedki Riad and Bill Gans joined the group, again moving us forward by another order of magnitude in speed. This group built our first computer controlled sampling oscilloscope. We developed software to average samples and process the data with digital deconvolution [128]. These advances allowed us to reduce the noise and remove the flaws of the oscilloscope from the measured data, significantly improving the accuracy of the system. Up to this time, all of our work was done in precision coaxial transmission lines. It was in the mid-1970s that work first began on the free-field time-domain range. It was to be a vertical metal cone positioned over a metal ground plane. The resulting conical transmission line had been well analyzed theoretically. The initial ground plane was only 1.2 m square (4') with a 91.4 cm cone (3'). The system was designed to generate a spherically symmetric calculable field. This field was then used to characterize a wide variety of antenna and sensor types [129]. Around the same time, the first NBS picosecond impulse generator was designed and built. It could produce a roughly Gaussian-shaped pulse several volts in amplitude and about 350 picoseconds in duration. After purchasing a new sampling oscilloscope that had about 100-picosecond rise-time, NBS was in business. During the 1980s NBS fabricated a 9.1 m cone (30'), shown in Figure 4, to be used in conjunction with the OATS ground plane. This facility was highly useful for the calibrations of EMC antennas such as the log-spiral antenna in the frequency range of 20 MHz to 2 GHz. The ground plane was enlarged several times over the subsequent years, reaching 6.1 m square (20') around 1980. Norris Nahman initiated a new ultra-high-speed optical sampling device intended for the measurement of electromagnetic fields. A sub-picosecond sampling impulse would be transmitted to the sampler over an optical fiber, eliminating the need for conductive wires. The sampler was to be used in EM environments where the wires would distort the fields we were trying to measure. Bob Lawton developed the solid-state sampler, which produced a five picosecond optical pulse from a mode-locked neodymium glass laser. More recently, work has focused on practical measurements and techniques. We have developed a family of measurement systems and techniques for the evaluation of RF absorbers and RF absorber-lined chambers. NIST has extended this capability to other types of facilities such as OATS with shelters, and developed a new capability in the measurement of time-domain emissions when we participated in a National Telecommunications and Information Administration (NTIA) evaluation of the time- and frequency-domain emissions characteristics of commercially available ultrawideband devices [130]. NIST has also been quite active in the evaluation of shielding properties of aircraft [131], in which NIST has recently performed an extensive set of shielding performance measurements on a commercial jet airliner in a hanger environment. Current and future work in the time domain area includes:
Contact: Robert Johnk (303-497-3737, johnk@boulder.nist.gov) 8. Probe Development NIST has developed electromagnetic-field probes for a variety of applications over many years. The probes include prototypes for CW field measurements, pulse or broad-bandwidth field measurements in the time domain, and measurements in the near field where the electric and magnetic components do not maintain plane-wave relationships. They also include probes, used as check standards, for measuring the standard fields used to calibrate antennas and commercial probe systems, and as transfer standards for use by various test laboratories. The earlier work was mostly directed toward CW measurements and use of isotropic probes for environmental assessments. A probe developed by Ezra Larsen and Jim Andrews [132], shown in Figure 10, used optical fibers to reduce the coupling between the leads and the probe elements in an isotropic probe. A broadband electric-field monitor was developed by Jose Cruz [133] and an isotropic magnetic-field meter was developed by Lanny Driver and Jose Cruz [134]. Probes formed from resistively tapered dipole elements were developed at NIST during the 1980s [135] and now serve in several of the applications noted above. A key contributor to the development of these probes at NIST was the late Motohisa Kanda who was recently honored with a special issue of the IEEE Transactions on Electromagnetic Compatibility [136]. The tapered resistance provides an impedance match between the gap and free space that suppresses resonances and increases the useable bandwidth over that from a metallic dipole of equivalent length. These probes are also well suited for waveform measurements of electromagnetic pulses used in time domain analysis of antennas and materials. More recently, NIST has used advancements in fiber optic and electro-optic technologies to further develop probes that provide both electrical isolation from signal processing instrumentation and minimal perturbation of the measured field [137]. The amplitude and phase of the electromagnetic signals are maintained so that vector field measurements can be obtained. In one implementation of this technology, we combined the photonic signal leads with a loop antenna having two resistively loaded gaps. This probe has the capability of simultaneously measuring electric and magnetic field components at the same point in space [138-139]. Another application of the double-gap loops is a three-loop system that has been analyzed [140] and tested [141] for measuring the electric and magnetic dipole moments of unknown radiators placed at the center of three orthogonal loops.
In a slightly different application of photonic technologies, Jim Randa, Moto Kanda, and David Orr [142] developed power-absorbing tips for an optical-fiber, temperature-sensing unit that could measure electromagnetic fields at frequencies above 10 GHz. Current and future work in this area includes:
Contact: Keith Masterson (303-497-3756, masterson@boulder.nist.gov) 9. Conclusion The world of EMC has changed significantly in the almost 50 years since President Eisenhower dedicated the Radio Building in Boulder. An aerial photo of the growing Department of Commerce (DOC) Boulder campus is shown in Figure 11. NBS has changed to NIST and Boulder has grown from a sleepy college town to part of a growing metro area. What has not changed is the dedication of the NIST staff to making accurate measurements and serving the public and technical community. We look forward to the challenges of the next 50 years.
10. References OATS
ANECHOIC CHAMBERS
ITEM CELLS
REVERBERATION CHAMBERS
TIME DOMAIN RANGES
FIELD PROBES
The references are not reproduced in the printed version of the newsletter due to space limitations. EMC *U.S. Government work not protected by U.S. copyright. |
|||||||||
|
If you would
like to contact the IEEE Webmaster |