In this issue you will find two practical papers that
should be of interest to the EMC community. The first
paper is entitled, "Electromagnetic Attenuation with
Stainless-Steel Fiber Mesh" and is by several authors
from the medical community in Japan. They were specifically
concerned about the shielding properties of flexible "metal
mesh" to waves at different polarizations at frequencies
higher than 1 GHz. I think that you will find the results
presented here very interesting. The second, "Time
and Frequency Domain Analysis of EMC Test Facilities"
is about a methodology to determine the quality of an
EMC test facility using equipment generally available
to RF testing services and has been written by several
members of the NIST staff. As one reviewer said, "this
is not new, but it is well worth publicizing among EMC
engineers."
The purpose of this section is to disseminate practical
information to the EMC community. In some cases the material
is entirely original. In others, the material is not new
but has been made either more understandable or accessible
to the community. In others, the material has been previously
presented at a conference but has been deemed especially
worthy of wider dissemination. Readers wishing to share
such information with colleagues in the EMC community
are encouraged to submit papers or application notes for
this section of the Newsletter. Click
here for my e-mail. While all material will be reviewed
prior to acceptance, the criteria are different from those
of Transactions papers. Specifically, while it is not
necessary that the paper be archival, it is necessary
that the paper be useful and of interest to readers of
the Newsletter.
Comments from readers concerning these papers are welcome,
either as a letter (or e-mail) to the Associate Editor
or directly to the authors.
|
Electromagnetic Attenuation with Stainless-steel
Fiber Mesh
Eisuke Hanada1),
Kyoko Takano2),
Yasuaki Antoku3),
Kouji Matsumura3),
Yasushi Hoshino4),
Toshiya Nishimura4),
Kennichi Hyoudou4),
Yoshiaki Watanabe5),
Yoshiaki Nose2)
1) Department of Medical Informatics, Shimane Medical University
School of Medicine
2) Department of Medical Information Science, Graduate School
of Medical Sciences, Kyushu University
3) Department of Medical Information Science, Kyushu University
Hospital
4) Department of Electromagnetic Wave Shielding, Clean Shield
Division, Nippon Sheet Glass Environmental Amenity Co., Ltd.
5) Department of Information Science, Faculty of Science and Engineering,
Saga University
Corresponding address:
Eisuke Hanada
Department of Medical Informatics,
Shimane Medical University School of Medicine
Izumo, 693-8501, Japan
E-mail: e-hanada@shimane-med.ac.jp
Abstract
Shielding from radio waves to prevent electromagnetic interference
using "metal mesh," mesh made of metal fibers, is well
documented. However, in shielding material catalogs, only attenuation
against radio waves at frequencies less than 1.0 GHz is mentioned.
In addition, only attenuation against waves from one polarization
is mentioned, even if the mesh windows are not square or the metal
content of the vertical and horizontal fiber differs.
Therefore, we measured the attenuation of metal fiber mesh, made
by twisting short stainless-steel threads, of various shapes and
sizes at a wide range of frequencies with two polarizations and
two measurement methods. To test radio waves at frequencies of
1.0 GHz or lower, we adopted the method developed by the Kansai
Electronic Industry Development Center (KEC). The attenuation
against radio waves at frequencies over 300 MHz was measured by
the loss insertion method using an electromagnetic anechoic chamber.
Attenuation differed by method, even in the same frequency range.
Attenuations also differed with changes in polarization when the
mesh windows were rectangular. It was also confirmed that the
length of the minimum composition unit of the metal fiber influenced
attenuation.
Keywords: Mesh, metal fiber, electromagnetic shielding,
KEC method, loss insertion method
I. Introduction
The use of mobile telephones in hospitals is often restricted
because of electromagnetic interference (EMI) with medical electric
equipment by radio waves transmitted from these devices. A good
prevention method for combating EMI is electromagnetic shielding.
Shielding from radio waves is possible using materials containing
metal fibers. Mesh shielding materials, in which the fibers contain
metal or that are made totally of metal (hereafter, metal mesh),
are marketed and widely available. Metal mesh is flexible and
lightweight. In addition, it has higher optical permeability than
woven and non-woven fabrics made with metal fiber. However, in
shielding material catalogs, only attenuation against radio waves
at frequencies less than 1.0 GHz is mentioned. In addition, only
attenuation against waves from one polarization is mentioned,
even though metal mesh windows are not always square. Radio waves
at various frequencies and with various polarizations are transmitted
in urban areas [1]. The fundamental characteristics of electromagnetic
shielding with a metal grid have been reported [2-5], but the
shielding characteristics of mesh made of twisted metal threads
are unknown. We measured the effect of a wide frequency band on
the attenuation of metal mesh of various shapes and sizes.
II. Methods
1) Metal Mesh
The fibers used were made by twisting short stainless steel 32/2
strings. The characteristics of the fiber are shown in Table 1.
The metal mesh was knit using these fibers to eliminate problems
with fiber constitution. The mesh structure and sizes are shown
in Figure 1. The mesh structures were square and rectangular.
For square meshes, the intervals between the centers of warps
(vertical pitches, "a" in Figure 1) and the centers
of woofs (horizontal pitches, "b" in Figure 1) were
3 mm, 5 mm, and 7 mm. For rectangular mesh, the warp and woof
pitches were 3 mm and 5 mm. Hereafter, any mesh for which the
horizontal pitch was 3 mm and the vertical pitch was 5 mm is called
"3 x 5 " mesh. However, the woof of the mesh tested
was made with three parallel fibers and the warp had two threads.
Therefore, although the mesh was square, the size of the window
( "c " and "d " in Figure 1) was not. It was
rectangular, with a length to width ratio of about 5:7. The size
of the window of each mesh is shown in Table 1.
2) Measuring Methods and Frequencies
Investigated
The total frequency range of the measurement was from 10 MHz to
10 GHz. The attenuation against radio waves at frequencies over
300 MHz was measured by the loss insertion method [6] using an
electromagnetic anechoic chamber. Against radio waves at frequencies
of 1.0 GHz or lower, attenuation was measured by a method developed
by the Kansai Electronic Industry Development Center, Osaka, Japan
(hereafter called the "KEC" method) [7,8]. For frequencies
from 300 MHz to 1.0 GHz, attenuation was measured by both methods.
a) Measurement by the KEC Method
The KEC method has often been used for measuring the attenuation
of electromagnetic shielding materials in Japan because this method
does not require an anechoic chamber, which is too expensive for
most researchers. With the KEC method, measurement is performed
in a small shielded box to eliminate influence by radio waves
other than the desired object. A block diagram of this system
and details of the shield box used in this method are shown in
Figure 2, and the equipment used is shown in Table 2. Each mesh
was cut into a 230 mm square and inserted into the measurement
equipment.
The attenuation of electric field intensity (Ae) was calculated
as the difference between the receiving levels when a sample was
set (E1) or not set (E2) in the chamber. The equation (1) is as
follows [8,9].
 (1)
(1)
The transmitted radio wave frequencies were every 10 MHz in the
range from 10 MHz to 100 MHz and every 100 MHz from 100 MHz to
1.0 GHz. Radio waves of 15 MHz and 150 MHz were also transmitted.
A 13 dBm sin wave was transmitted at right angles to the metal
mesh shielding material sample at all frequencies.
b) Measurement by the Loss Insertion
Method
The loss insertion method differs from the KEC method in that
it allows not only large pieces of material to be measured, but
also allows the antennas to be set freely over a range of distances.
In this study, by use of the loss insertion method it was possible
to imitate the walls and windows on which shielding material would
actually be installed [10].
A block diagram of the measurement system used in the loss insertion
method is shown in Figure 3. Shielding material (mesh) was fixed,
using metal plates, to an open 560 mm square window on the door
of the anechoic chamber. A wave generator was set on the outside
of the anechoic chamber and connected to the transmitting antenna.
A double-ridged guide antenna was used for frequencies of 1.0
GHz or higher, and a log-periodical antenna was used for frequencies
less than 1.0 GHz. The receiving antenna, an antenna of the same
style as the transmitting antenna, was placed in the anechoic
chamber and connected to a spectrum analyzer. Equipment used in
the measurement is shown in Table 2. The antennas were adjusted
so that the transmitted waves were radiated to the mesh at right
angles.
The attenuation was calculated as the difference of the receiving
levels (attenuation of electric field intensities) between when
a sample was set (E1) or not set (E2) in the window of the anechoic
chamber. The equation for attenuation (Ae) calculation was the
same as for equation (1).
The transmitted radio wave frequencies were every 100 MHz in the
range from 300 MHz to 1.0 GHz, and every 1.0 GHz from 1.0 GHz
to 10 GHz. In addition, radio waves of the following frequencies
were also transmitted: 1.5 GHz, which is used in all Japanese
cellular phone systems, 1.9 GHz as used in Japanese personal handy-phone
systems [11], and 2.45 GHz as used in wireless LANs and in microwave
ovens. At each frequency, a sin wave was transmitted at 13 dBm
output power.
 |
| Figure 1 Structure of Stainless Mesh |
III. Results
The measurement results by the KEC method are shown in Figure
4.1. When the mesh window was square, the attenuation increased
or stayed almost the same in response to radio waves at frequencies
up to 150 MHz for 3 mm pitch, up to 300 MHz for 5 mm pitch, and
up to 500 MHz for 7 mm pitch. (Hereafter, the frequency at which
the maximum attenuation was found is referred to as the "peak
frequency".) When the mesh was rectangular, the peak frequency
of the "5 x 3" mesh was 30 MHz and that of the "3
x 5" mesh was 150 MHz. When the transmitted radio wave exceeded
these frequencies, attenuation decreased at a rate of 20 dB with
each ten-fold frequency increase, except in the range from 700
MHz to 1.0 GHz.
The measurement result by the loss insertion method is shown in
Figure 4.2. Against radio waves at frequencies of 300 MHz and
higher, the decrease of attenuation was almost linear to the log
scale of frequency. In addition, both measurements showed attenuation
decreases at frequencies from 700 MHz to 1.0 GHz that did not
follow the pattern found in the other frequency ranges. The decrease
in the attenuation effect from 1.0 GHz to 1.9 GHz also did not
follow the pattern found in the other frequency ranges.
Measurement of radio waves in the frequency range from 300 MHz
to 1.0 GHz was done with both the KEC method and the loss insertion
method. Attenuation by the KEC method was lower than the attenuation
by the loss insertion method at each frequency. The difference
in attenuation between the two methods at the same frequency differs
with the frequency and the pitch of the mesh.
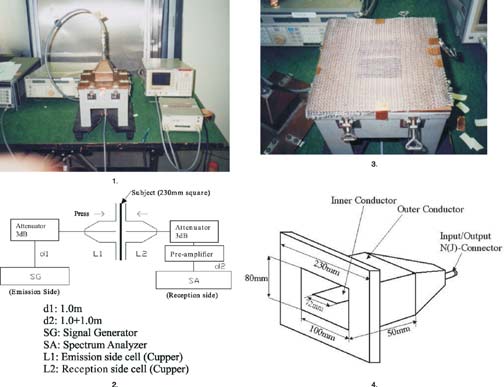 |
| Figure 2 Structure of the KEC Method,
Overview of the shield box and equipment used in the KEC method,
Block diagram of equipment used with the KEC method, Subject
set on the lower half of the shield box, Structure of the
shield box. |
IV. Discussion
 |
| Figure 3 Block Diagram
of Equipment Used with the Loss Insertion Method. |
1) Attenuation by Metal Mesh
The attenuation was almost the same when the frequencies were
lower than the peak frequency, as shown in Figure 4.1. Because
the subject meshes were made of fibers consisting of only one
material and were of the same constitution, the quantity of the
electromagnetic wave (the amount of energy) that could be absorbed
by one metal thread did not vary with the pitch of the mesh, but
was always the same. As the frequency of the radiated radio wave
becomes higher, the amount of absorbable electromagnetic energy
of the thread-like metal becomes smaller [12]. Therefore, when
the frequency of the radiated radio wave becomes higher, the attenuation
becomes lower. On the contrary, since the energy that can be absorbed
increases as the number of fibers increases, the attenuation per
unit area will be higher as the pitch of the mesh becomes smaller
(there are more threads per unit). As the frequency of the radiated
electric wave becomes lower, the metal fiber seems to become saturated,
and the attenuation at lower frequencies will not increase. Therefore,
mesh with larger pitches probably became saturated at higher frequencies.
Although this phenomenon has been hypothesized, no proven reports
were found.
In our measurements, the decrease of attenuation at two frequency
bands near 800 MHz and near 2 GHz was not fixed and the value
was higher than the expected attenuation. One of the reasons could
be that each string took on the function of an antenna. When the
length of a staple is half or a quarter the wavelength of the
radiated radio waves, the staple acts as an antenna that shows
the highest receiving characteristic.
 |
| Figure 4 Electric Field Intensity
Attenuation of Mesh. |
2) Differences of Attenuation Between
the Two Measurement Methods
In the frequency range from 300 MHz to 1.0 GHz, the results by
the two measurement methods were different. One possible cause
of this difference is that measurement by the KEC method is always
in the near region and in the far region by the loss insertion
method. When measuring with the KEC method, radiation from the
mesh, or reflection between the sample and spectrum analyzer,
seems to have occurred. Therefore, rather than determining the
electromagnetic wave that actually passed, the possibility exists
that the receiving antenna received stronger electric field intensity.
3) Polarization in the Attenuation of
Mesh Used as a Shielding Material
Both the KEC and the loss insertion methods showed differences
in attenuation at different polarization when mesh windows were
not square. This indicates that if the mesh is not square or the
metal content of the warp and of woof differs, catalogs should
list the attenuation effect of mesh-like shielding material against
waves from at least two polarizations, horizontal and vertical.
V. Conclusion
We surveyed the attenuation of metal mesh of various shapes and
sizes at a wide range of frequencies at two polarizations using
two measurement methods. We found that the length of the minimum
composition unit of a twisted metal fiber influences attenuation.
We also found that when evaluating the attenuation of commercial
mesh shielding material, differences in attenuation at different
polarizations should be verified.
Acknowledgement
The authors wish to heartily thank Meiko Trading, Inc. for providing
us the metal mesh materials for this study. This study was supported
by grants-in-aid from the Japan Society for the Promotion of Science
(No.14370771).
References
1. E. Hanada, K. Kodama, K. Takano, Y. Watanabe and Y. Nose, "Possible
Electromagnetic Interference with Electronic Medical Equipment
by Radio Waves Coming from Outside the Hospital," Journal
of Medical Systems vol. 25 No.4, pp.257-267, 2001
2. T. Larsen, "A Survey of the Theory of Wire Grids,"
IRE Trans. MTT, vol. 10, pp.191-201, 1962
3. G.A. Otteni, "Plane Wave Reflection from a Rectangular
Mesh Ground Screen," IEEE Trans. AP, vol. 21, no.
6, pp.843-851, 1973.
4. K.F. Casey, "Electromagnetic Shielding Behavior of Wire-Mesh
Screens," IEEE Trans. EMC, vol. 30 No.3, pp.298-306,
1988.
5. S. Chrisatine and A. Orlandi, "An Equivalent Transmission
Line Model for Electromagnetic Penetration Through Reinforced
Concrete Walls," IEICE Trans. Commun., vol. E78-B,
no. 2, pp. 218-229, 1995.
6. Department of Defense (U.S.A.), "MIL-STD-285 Military
Standard Attenuation Measurements for Enclosures, Electromagnetic
Shielding, for Electronic Test Purposes, Method of," 1956
June.
7. E. Hariya, and M. Umano, "Instruments for Measuring the
Electromagnetic Shielding Effectiveness," 1984 IEEE International
Symposium on Electromagnetic Compatibility, 2, 1984, Tokyo, Japan.
8. E. Hariya, M. Umano, N. Morinaga and Y. Nagasawa. "Experimental
Investigation on the Electromagnetic Shielding Effectiveness"
(in Japanese), IECE Technical Report, MW85-68, pp.9-16,
1985.
9. A. Manara, "Measurement of Material Shielding Effectiveness
Using a Dual TEM Cell and Vector Network Analyzer," IEEE
Trans. EMC, vol.38 No.3, pp.327-333, 1996
10. E. Hanada, Y. Watanabe, Y. Antoku, K. Kenjo, H. Nutahara and
Y. Nose, "Hospital Construction Materials: Poor Attenuation
Effect with Respect to Signals Transmitted by Mobile Telephones,"
Biomedical Instrumentation & Technology vol.35 No.4,
pp.489-496, 1998.
11. E. Hanada, Y. Antoku, S. Tani, M. Kimura, A. Hasegawa, S.
Urano, K. Ohe, M. Yamaki and Y. Nose, "Electromagnetic Interference
to Medical Equipment by Low Power Mobile Telecommunication System,"
IEEE Trans. EMC, vol.42 No.4, pp.470-476, 2000
12. DDL. Chung, "Electromagnetic Interference Shielding Effectiveness
of Carbon Materials," Carbon, Vol.39, pp.279-285,
2001.
 Eisuke
Hanada was born in Tokyo, Japan, in 1963. He received his
B.Eng. and M.Eng. degrees from Kyushu University, Fukuoka, Japan,
in 1985 and 1987, respectively. He received his D.Eng. degree
from Saga University, Saga, Japan, in 2001. Since 1992, he has
worked at Nagasaki University Information Science Center for four
years managing the campus LAN and information servers, and at
the Department of Medical Information Science, Kyushu University
Graduate School of Medical Science. Since 2002, he has been working
at the Department of Medical Informatics, Shimane Medical University
Hospital. His research involves the wired/radio communication
environment and information processing systems in hospitals.
Eisuke
Hanada was born in Tokyo, Japan, in 1963. He received his
B.Eng. and M.Eng. degrees from Kyushu University, Fukuoka, Japan,
in 1985 and 1987, respectively. He received his D.Eng. degree
from Saga University, Saga, Japan, in 2001. Since 1992, he has
worked at Nagasaki University Information Science Center for four
years managing the campus LAN and information servers, and at
the Department of Medical Information Science, Kyushu University
Graduate School of Medical Science. Since 2002, he has been working
at the Department of Medical Informatics, Shimane Medical University
Hospital. His research involves the wired/radio communication
environment and information processing systems in hospitals.
Dr. Hanada is a member of the Japanese Society of Medical Informatics,
the Information Processing Society of Japan, and the Acoustical
Society of Japan.
 Kyoko
Takano was born in Fukuoka, Japan in 1970. She received her
B.Econ. and M.Info. degrees from Teikyo Heisei University, Ichihara,
Japan, in 1996 and 1998, respectively. She has been a research
resident at the Department of Medical Information Science, Kyushu
University Graduate School of Medical Sciences since 1998. Her
research interest is the electromagnetic environment of hospitals
and educational methods for nursing school students.
Kyoko
Takano was born in Fukuoka, Japan in 1970. She received her
B.Econ. and M.Info. degrees from Teikyo Heisei University, Ichihara,
Japan, in 1996 and 1998, respectively. She has been a research
resident at the Department of Medical Information Science, Kyushu
University Graduate School of Medical Sciences since 1998. Her
research interest is the electromagnetic environment of hospitals
and educational methods for nursing school students.
Ms. Takano is a member of the Japanese Society of Medical Informatics.
 Yasuaki
Antoku was born in Fukuoka, Japan, in 1970. He received his
B.Eng. from Kyushu Institute of Technology, Fukuoka, Japan, in
1996. He is currently working at the Department of Medical Information
Science, Kyushu University Graduate School of Medical Sciences.
He is researching hospital LAN systems and is managing Internet
servers.
Yasuaki
Antoku was born in Fukuoka, Japan, in 1970. He received his
B.Eng. from Kyushu Institute of Technology, Fukuoka, Japan, in
1996. He is currently working at the Department of Medical Information
Science, Kyushu University Graduate School of Medical Sciences.
He is researching hospital LAN systems and is managing Internet
servers.
 Kouji
Matsumura was born in Kochi, Japan, in 1973. He received his
B.Eng. from Osaka University, Osaka, Japan, in 1996. He is currently
working at the Department of Medical Information Science, Kyushu
University Graduate School of Medical Sciences. He is researching
hospital information systems and is managing Internet servers.
Kouji
Matsumura was born in Kochi, Japan, in 1973. He received his
B.Eng. from Osaka University, Osaka, Japan, in 1996. He is currently
working at the Department of Medical Information Science, Kyushu
University Graduate School of Medical Sciences. He is researching
hospital information systems and is managing Internet servers.
 Yasushi
Hoshino was born in Tokyo, Japan, in 1973. He received his
B.Eng. and M.Eng. degrees from Science University of Tokyo, Tokyo,
Japan, in 1997 and 1999, respectively. Since 1999 he has been
working at the Department of Shielding Electromagnetic Waves,
Nippon Sheet Glass Environment Amenity Co. Ltd.
Yasushi
Hoshino was born in Tokyo, Japan, in 1973. He received his
B.Eng. and M.Eng. degrees from Science University of Tokyo, Tokyo,
Japan, in 1997 and 1999, respectively. Since 1999 he has been
working at the Department of Shielding Electromagnetic Waves,
Nippon Sheet Glass Environment Amenity Co. Ltd.
Mr. Hoshino is a member of the Architectural Institute of Japan.
 Toshiya Nishimura was born in Kyoto, Japan, in 1973. He received
his B.Eng. degree from Shibaura Institute of Technology, Tokyo,
Japan, in 1996. Since 1996 he has been working at the Department
of Shielding Electromagnetic Waves, Nippon Sheet Glass Environment
Amenity Co. Ltd.
Toshiya Nishimura was born in Kyoto, Japan, in 1973. He received
his B.Eng. degree from Shibaura Institute of Technology, Tokyo,
Japan, in 1996. Since 1996 he has been working at the Department
of Shielding Electromagnetic Waves, Nippon Sheet Glass Environment
Amenity Co. Ltd.
 Kennichi
Hyoudou was born in Ehime, Japan, in 1966. He received his
B.Eng. degree from Oita University, Oita, Japan, in 1996. Since
1996 he has been working at the Department of Shielding Electromagnetic
Waves, Nippon Sheet Glass Environment Amenity Co. Ltd.
Kennichi
Hyoudou was born in Ehime, Japan, in 1966. He received his
B.Eng. degree from Oita University, Oita, Japan, in 1996. Since
1996 he has been working at the Department of Shielding Electromagnetic
Waves, Nippon Sheet Glass Environment Amenity Co. Ltd.
 Yoshiaki Watanabe received his D.Eng. degree from Kyushu University,
Japan, in 1978. He has been an assistant at Kyushu University,
a lecturer at Kyushu University Hospital, and an associate professor
at Saga University, Japan. Since 1990, he has been professor of
the Department of Information Science at Saga University. His
research interests are in the fields of neural networks and biomedical
engineering.
Yoshiaki Watanabe received his D.Eng. degree from Kyushu University,
Japan, in 1978. He has been an assistant at Kyushu University,
a lecturer at Kyushu University Hospital, and an associate professor
at Saga University, Japan. Since 1990, he has been professor of
the Department of Information Science at Saga University. His
research interests are in the fields of neural networks and biomedical
engineering.
 Yoshiaki
Nose was born in Fukuoka, Japan, in 1944. He received his
MD and Ph.D. degrees from Kyushu University, Fukuoka, Japan, in
1969 and 1973, respectively. He is currently professor and chairman
of the Department of Medical Information Science, Kyushu University
Graduate School of Medical Sciences and the Medical Information
Center at Kyushu University Hospital.
Yoshiaki
Nose was born in Fukuoka, Japan, in 1944. He received his
MD and Ph.D. degrees from Kyushu University, Fukuoka, Japan, in
1969 and 1973, respectively. He is currently professor and chairman
of the Department of Medical Information Science, Kyushu University
Graduate School of Medical Sciences and the Medical Information
Center at Kyushu University Hospital.
ULTRAWIDEBAND TIME- AND FREQUENCY-DOMAIN
CHARACTERIZATION OF EMC FACILITIES
David R. Novotny, Robert T. Johnk, Claude
Weil, Nino Canales
National Institute of Standards and Technology
RF Technology Division
325 Broadway
Boulder, CO 80305-3328
www.boulder.nist.gov/div813
Abstract
We have developed a methodology to determine the quality of an
EMC (Electromagnetic Compatibility) test facility using equipment
generally available to RF testing services. By utilizing the time-
and frequency-domains, an accurate picture of the scattering and
modal properties of a facility can be determined. This gives more
information about performance than traditional scalar, swept frequency
measurements of the facility. While the frequency information
given from traditional Normalized Site Attenuation (NSA) type
measurements can indicate facility performance issues, this dual-domain
method can highlight the causes of facility irregularities. This
can help eliminate guesswork and focus remediation efforts on
a facility that may be out of compliance.
Keywords: Chamber, EMC, facility evaluation, fully anechoic
room, FAR, normalized site attenuation, NSA, OATS, Time-Domain,
ultra-wideband, UWB.
1. Introduction
Most current EMC and RF testing facilities have components that
make the facility diverge from an ideal testing environment. Finite
ground planes, shelters, obstructions, and positioning equipment
can cause open area test sites (OATS) to vary from the idealized
model of a free-space antenna over an infinite ground plane. These
irregularities can be manifested as deviations in the NSA and
can affect confidence in measurement results or increase measurement
uncertainty. Similarly, unoptimized absorber, ventilation and
access pathways, surface discontinuities, and obstructions such
as mounting and fire-suppression hardware can cause anechoic chambers
(and their semi-anechoic counterparts) to exhibit a less than
desired complex scattering environment as opposed to the desired
free-space operation. This can cause anomalies in measurements
taken in the facility.
We have developed a self-referencing technique [1-3] that illuminates
the facility with a short-time, ultra-wide frequency-band impulse
using a broad-spatial beam width antenna system. By using both
the time- and frequency-domains, a fault or scattering center
can be located in time and space and, through gating the frequency
effects on the overall system, can be determined.
We show data taken at several facilities and the frequencies at
which the facilities are experiencing less than optimal operation.
The time-domain analysis shows where faults are located. By utilizing
both domains in our analysis, corrective solutions can be suggested
and tests quickly retaken. While this is not a totally comprehensive
test method, we believe that the technique shows great promise
as a pre-compliance test and a fault locator.
 |
| Figure 1. The 1.5 GHz Impulse Response
of the TEM Horn Antenna System. This reference measurement
yields an effective range resolution of 30 cm and a baseline
for measuring the frequency response of the facility. |
2. Measurement Setup
In order to discriminate between scattering centers, fine spatial
resolution over a large frequency span is required. Additionally,
an ultrawideband, short-impulse antenna system is needed to transmit
and receive the stimulus with a minimum of dispersion and antenna
ring-down. Most current EMC standards mandate the testing of radiated
emissions in the frequency range of 30-1000 MHz. This paper deals
with testing in this range and along with the associated setup
and procedure to ensure the acquisition of U.S. Government work,
is not subject to copyright.
These measurements can be performed using either an impulse generator
and oscilloscope with suitable frequency coverage or a vector
network analyzer (VNA) to analyze the facility. The oscilloscope
offers an unaliased transform and better ambient signal rejection;
however (using normally available pulse systems), it lacks the
dynamic range of a VNA. If a VNA is used, care must be taken to
have a suitable number of frequency points and coverage to have
an unaliased time window long enough and time resolution fine
enough to discriminate between spatial events.
We have chosen to use a VNA for this series of measurements because
of stability, availability and overall dynamic range. We took
802 data points evenly spaced from DC to 2000 MHz in 2.5 MHz steps.
This resulted in an unaliased time window of 400 ns and an impulse
response corresponding to a range resolution of approximately
15 cm, shown in Figure 1. The DC point was interpolated from the
S21 data with a least-mean-squares circle fit to a real value
using the initial complex data values taken with the VNA. Generally,
a measurement window of 400 ns is adequate for a reasonably sized
EMC facility. Our measurements confirm that most facility ringing
has been attenuated well before 400 ns, so aliasing is not a problem.
While the upper frequency limit of 2000 MHz is beyond the 3 dB
bandwidth of the antennas and above the general usage of these
facilities, the antenna falloff can be calibrated out and corrected.
The extension in frequency beyond 1000 MHz and facility performance
is of interest to the facility operators.
The antenna system consists of a pair of matched TEM horns. Several
NIST researchers have constructed different TEM horns covering
a variety of frequency ranges [4, 5]. They utilize a resistive
termination to prevent aperture reflections and longitudinal moding
in the horn. The horns we used have a nominal antenna factor of
25 dB from 25 to 1200 MHz and with their size of 1.2 x 0.3 x 0.3
m, offer a relatively small scattering cross-section and little
facility loading. This allows modal structures to be accurately
measured. The TEM horn design offers a broad frequency range of
operation and a constant electrical phase center with a very short
impulse response, which allow for minimal dispersion of the stimulus.
The small aperture (0.3 x 0.3 m) creates a broad pattern that
illuminates a large portion of the facility under test and provides
fine spatial sampling.
 |
| Figure 2. Basic Data Processing Diagram.
If the direct path between the horns is unobstructed, and
the impulse response is time-separable from the ground-bounce
and facility ringing, then only one self-referencing measurement
is needed. |
3. Measurement Methodology
These measurements are self-referencing; they do not rely on calibrated
antennas or other reference artifacts to analyze the facility.
By spacing the antennas in close proximity to each other (or over
a small, well-defined, reflector for OATS evaluation) the horn-to-horn
coupling can be isolated from any external interference by appropriate
time gating. This gives an accurate reference that can be compared
to the facility measurements. Often these reference measurements
can be performed either as a part of the facility measurements
or as a special setup at the facility. To ensure that the entire
facility is subjected to testing, a number of spatial positions
and polarizations are generally taken to ensure full illumination
of the test site. Special care is taken to cover typical or regulatory
dictated test volumes or antenna and device under test (DUT) configurations.
By comparing the various spatial measurements, faults can be analyzed
for more than one aspect angle, and triangulated so that they
can be directly identified.
The data processing model is shown in Figure 2. Once the facility
and reference measurements are taken, the time-domain behavior
is analyzed and time gates can be applied around specific events
or sections of the data. The resultant gated waveforms are transformed
back to the frequency-domain and normalized to the antenna reference.
By not applying a time gate to the facility data, the overall
response of the facility can be determined. Time-gate applications
can identify and separate out the quality of the OATS surface,
sidewall reflections in anechoic chambers, or modes and late-time
ringing in the facility.
 |
| Figure 3. Relative Antenna and Shelter
Positions Used in the Measurement of the Partially Covered
OATS Facility. |
4. OATS Evaluation
A commercial OATS was measured to assess the effects of a limited
ground plane and a fiberglass shelter built to cover the DUT,
but not the measurement antenna. The general layout is shown in
Figure 3. To reduce edge reflections, the long, narrow ground
plane is electrically connected to a tapered hill. The structure
is a large fiberglass and foam building meant to protect equipment
from the elements. RF energy penetrates the structure's walls
before the outside antenna receives it. Additionally, there was
concern that the structure may have some resonances that could
attenuate or enhance emission or immunity characteristics. This
could cause equipment to needlessly fail regulatory tests, be
unknowingly susceptible to interference, or pass a failing device
(a pre-compliance facility operator's constant headache).
The measurements were taken in two phases, as shown in Figure
4. The reference measurements were performed outside the equipment
shelter at horn aperture separations 2 m and 10 m so a clean horn-to-horn
measurement, without the shelter, could be made. This gave a reference
with which to compare the obstructed measurement and a horn-to-horn
reference to assess the quality of the ground plane. Then measurements
were made of the shelter effects by placing the antennas at typical
antenna and DUT positions.
The results, in Figures 5 and 6, showed a slight (<0.5 dB)
attenuation through the shelter and a delayed ground bounce (this
caused a shift in the 900 MHz null, which appears as a spike in
Figure 6). The more important effects were secondary scattering
from the shelter roof and ringing in the shelter that caused a
variation of 1 to 2 dB across the measurement band.
 |
| Figure 4. The Time-Domain Response
Plots Showing the 10m OATS Reference. |
5. Ferrite-Lined, Pre-Compliance Chamber
Evaluation
The NIST system was used to determine the effects of an upgrade
to a ferrite-lined pre-compliance chamber. This facility was smaller
than traditional chambers and reliable low-frequency performance
was a concern. The operator was adding additional absorber to
the chamber and was interested in the performance before and after
the modifications. Due to initial budget limitations at the time
of installation, a chamber of smaller than optimal size was procured,
and the operator wanted performance data, information on any chamber
imperfections, and possible remedies for them. There was exposed
metal around the ventilation intakes, floor and access door. Retrofits
attempting to cover these scatterers were planned with the measurement
effort, and the operator wanted to know how the chamber tested
before and after the changes.
The initial reference measurements were made in the center of
the facility well away from the walls and floor at an aperture
separation of 2 and 3 meters.
The time-domain analysis in Figure 7 showed that there were large
reflections from the floor. The ferrite tiles on the floor were
covered with a protective ESD carpet to protect the tiles and
to avoid static buildup that could damage the equipment under
test. This had the effect of reducing the effectiveness of the
floor absorber. There were also reflections from the sidewalls
of the chamber that were indicative of unoptimized absorber performance.
By using the relative timing differences in the received signal
and mapping the timing information with antenna position, triangulation
of the location of the unknown effects was possible. The analysis
showed that reflections were coming from the metal-ferrite edges
and the absorber on the walls. The wall scattering was mainly
due to the absorber being illuminated at large oblique angles,
for which it was not optimized. The operator used this data to
ameliorate the effects of these scattering centers.
The frequency-domain analysis, in Figure 8, showed large deviations
due to chamber moding, scattering and unoptimized absorber usage.
Without the dual-domain analysis, failure mechanisms would need
to be guessed using intuition. While the retrofits the operator
performed had some success, the results of our measurements showed
that, other than full replacement of the absorber system, treatment
of the specular reflections from the sidewalls and floors would
have been a better improvement and could have been a more optimal
use of retrofit funds.
 |
| Figure 6. The Raw, Frequency-domain
Transformed Data and Normalized Performance of the OATS Facility
in Horizontal-polarization at the Test Distance of 10 Meters.
The excursion around 900 MHz is due to propagation delays
through the shelter. |
 |
| Figure 5. The Time-Domain Response
of the OATS Facility. These measurements were taken through
the shelter with the TEM horns in the typical DUT and measurement
antenna locations (10m antenna separation, horizontal polarization). |
 |
| Figure 8. Frequency Response and
the Normalized Analysis of the Anechoic Chamber. The deviations
in the data are due to strong sidewall reflections, absorber
discontinuities, and long-term ringing in the facility. |
 |
| Figure 7. Time-Domain Plots Inside
a Ferrite-lined, Anechoic Chamber. At two separations, this
allows for spatial location of the "unknown effect"
by correlating the antenna locations and the relative timing
of the effect. The distance separation increased by 1m, which
accounts for the delay in the separation 2 and the delay difference
between the fault and the direct signal between the measurements
locates the fault 2.2 meters off the centerline of the antennas. |
6. Summary
The use of time-and frequency-domain analysis shows great promise
in facility evaluation. It provides the same information as the
current NSA and chamber qualification tests; however, it also
provides very useful insight into a facility's faults and whether
they can be mitigated. The time-domain can show the presence of
singular scatterers and modal buildups and discriminate between
them. Then the information can be transformed into the frequency
domain to determine the overall effects on the measurement system.
This is not a totally comprehensive test; only modes excited by
the antennas can be measured, so it is limited by the scope of
the antenna positions at which the measurements are taken. The
effects of large DUTs and DUT/facility interactions also may affect
facility performance not addressed by these tests. Yet we believe
that this method is an improvement over current methods of standard
facility testing and certification.
7. References
[1]. R. Johnk, D. Novotny, C. Weil, M. Taylor, T. O'Hara, "Evaluation
of a Fully Anechoic Chamber Using an Ultra-Wideband Measurement
System", Antenna Measurement Techniques Association 2001,
Proceedings of the, Denver, CO, pp. 321-26, Oct 2001.
[2] Johnk, R.T.; Novotny, D.R.; Weil, C.M.; Taylor, M.; O'Hara,
T.J, "Efficient and Accurate Testing of an EMC Compliance
Chamber Using an Ultra-Wideband Measurement System" 2001
IEEE International Symposium on Electromagnetic Compatibility,
Volume 1, page(s): 302 -307.
[3] Johnk, R.T.; Novotny, D.R.; Weil, C.M.; Medley, H.W. "Assessing
the Effects of an OATS Shelter: Is ANSI C63.7 Enough?" 2000
IEEE International Symposium on Electromagnetic Compatibility,
Volume 2, page(s): 523 -528.
[4] C. Grosvenor, D. Novotny, J Veneman, N. Canales, "Ultra-Wideband
TEM-Horn Antenna Design Using Numerical Methods," Antenna
Measurement Techniques Association 2002, Proceedings of the,
Cleveland, OH, Nov 2002.
[5] J. Veneman, D. Novotny, C. Grosvenor, R Johnk, N. Canales,
"Ultra-Wideband Antenna Pattern Characterization in a Non-Ideal
EM Facility," Antenna Measurement Techniques Association
2002, Proceedings of the, Cleveland, OH, Nov 2002.
8. Biographies
David Novotny has worked in the RF Technology Division
of NIST for over 12 years. Mr. Novotny earned his bachelor degree
in Electrical Engineering from the University of Colorado at Boulder
in 1990 and his M.S. degree in 1996. His research interests include
time-domain measurements and modeling, especially ultra-wideband
antenna and systems analysis.
Robert Johnk is the project leader of the NIST Time-Domain
Free-Field Metrology program, where he has worked for 13 years.
Dr. Johnk obtained his Ph.D. degree in electrical engineering
at the University of Colorado. Dr. Johnk's research interests
are time-domain scattering, sensor calibrations, shielding performance
measurements, antenna and sensor calibrations, numerical electromagnetics,
and ultra-wideband emissions metrology. Dr. Johnk has received
IEEE EMC Symposium and NIST best paper awards. Dr. Johnk is a
technical advisor to the United States Delegation to CISPR/A and
he is active in several CISPR and ANSI working groups.
Claude M. Weil (M'64-SM'95-F'00) was born in Newcastle-on-Tyne,
U.K., on June 26, 1937. He received the B.Sc. degree from the
University of Birmingham, Birmingham, U.K., in 1959, the M.S.E.
degree from George Washington University, Washington, D.C., in
1963, and the Ph.D. degree from the University of Pennsylvania,
Philadelphia, in 1970, all in electrical engineering. Prior to
1964, he worked as a Navy Systems and Instrumentation Engineer
and also designed microwave components and antennas. From 1971
to 1983, he was with the Environmental Protection Agency's research
program on the health effects of RF radiation. From 1983 to 1985,
he was with Boeing Military Aircraft Company, where he was involved
with radar cross-section (RCS) measurements and analysis. Since
1986, he has been with the Radio-Frequency Technology Division,
National Institute of Standards and Technology (NIST), Boulder,
CO, where he developed millimeter wave six-port systems and power
standards. He has served as a Senior Project Leader in the NIST
Electromagnetic Properties of Materials Program and is currently
a senior staff member in the NIST Time-Domain Free-Field Metrology
program. Dr. Weil is member of Sigma Xi and a fellow of the IEEE
Microwave Theory and Techniques Society (IEEE MTT-S) and the Instrumentation
and Measurements Society. He served as general chairman of the
1997 IEEE MTT-S International Microwave Symposium, Denver, CO.
Nino Canales joined NIST in 1989 after serving 20 years
in the US Army in the calibration field. Nino has a two-year science
degree from New York University and an under-graduate degree in
Business from Columbia College. Nino has over 30 years experience
in antenna measurements.
 Practical
Papers, Articles and Application Notes
Practical
Papers, Articles and Application Notes