Bob Rothenberg
Associate Editor
As you can see from the “Letters to the Editor” column in this issue, the Scott Bennett article in the Summer issue has been well read and debated. That’s a good sign that this section of your Newsletter is serving its purpose of both informing and facilitating a dialogue within the EMC community.
Following are two papers which should be of interest to EMC engineers and practitioners. The first, by Ken Javor of EMC Compliance, presents a strong case for relaxation of the FCC and CISPR limits on differential mode conducted emissions. The second, by Zhong Chen and Tim Harrington of EMC Test Systems, expands on the points made in their Letter to the Editor concerning the Bennett paper and test site performance.
Comments from readers are welcome, either as a letter (or e-mail) to the editor or directly to the authors. To submit a practical paper or article for publication consideration, send it via fax, e-mail or snail mail to this Associate Editor. See page 3 for addresses and fax number.
by Ken Javor
Radio response to power-line conducted noise is described. Radios are evaluated as to their susceptibility to common mode (cm) and differential mode (dm) noise. Results are compared to traditional susceptibility evaluation techniques.
Radios are found to be more susceptible to cm than to dm noise. Significant differences between these responses (20 dB) suggest the efficacy of conducted emission (CE) procedures and limits which separately control cm and dm CE. Filter design to meet present day CE limits is more difficult and expensive than that required to simply protect radios.
Adoption of new standards which reflect real radio frequency interference will decrease cost of EMC compliance, with benefits resulting to the entire electronics marketplace. It has been estimated that the suggested changes could save $35 million annually in the personal computer industry.
Conducted emissions (CE) standards imposed by governmental authority protect AM radios from the effect of power-line rfi. Test frequency range, bandwidth, and quasi-peak detection all are tailored to protect reception of amplitude modulated radio signals.
Conducted noise is measured between power conductor and ground. But the meaning of power conductor has changed over time. At the genesis of rfi control, power conductor meant phase or feeder, while ground meant both current return and power system reference — hence the line-to-ground topology of today’s line impedance stabilization network (LISN). Early standards inserted a LISN between power conductor and return, with return being power source reference (Figure 1, left). Determination of AM radio susceptibility to power-line CE (to set CE limits on office and information technology equipment) was made using this topology. (CBEMA, 1977) Today, power conductor means a current carrying conductor, which includes neutral. Today’s test inserts a LISN in each current-carrying conductor, each LISN bonded to power source reference (Figure 1, right). With this definition and configuration, CE appear not only between power conductor and ground, but also between different power conductors. CE standards, in accordance with tradition, control rfi measured between each current carrying conductor and ground (power system reference).
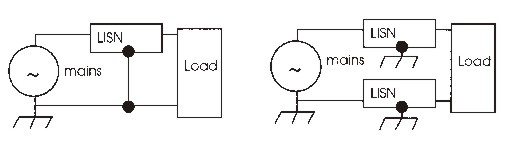
Figure 1: LISN placement and grounding, early (left) and present (right)
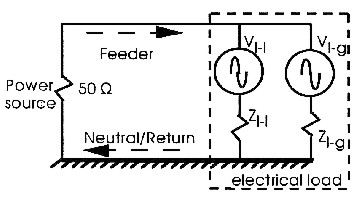
Conducted emissions flow in the paths shown in Figures 2 and 3. Figure 4 shows composite emissions (measured at LISN ports). Total rfi potentials measured at phase and neutral LISN ports are vector sums and differences of cm and dm CE, respectively.
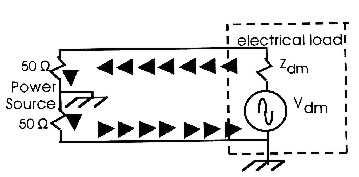
Figure 2: DM CE current
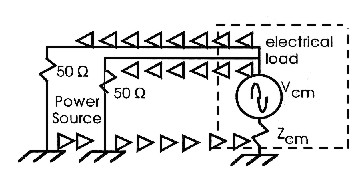
Figure 3: CM CE current
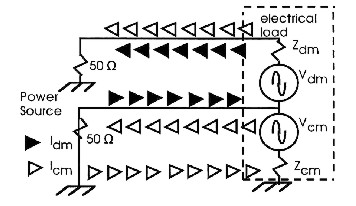
Figure 4: Composite cm/dm current in two-conductor above-ground power bus
In contrast, Figure 5 shows that an emission generating test sample connected to a single LISN inserted between phase and neutral can only generate an emission potential between that same phase and neutral. It has but one CE degree of freedom, even though two separate noise sources still exist. Figure 4 is the modern practice, with a LISN connected between each current-carrying power conductor and power system reference. Two CE noise potentials are possible, line-to-ground, and line-to-line (i.e., two CE degrees of freedom). Note that:
1) Measured CE are a linear combination of two independent kinds of CE: line-to-ground, or common mode, and line-to-line, or differential mode.
2) Commercial radio receivers are provided only phase/neutral (no safety ground) power wiring, disabling any technique providing line-to-ground filter protection.
Figure 5: RFI noise sources with single power conductor above ground
While present CE standards and test methods are sufficient to provide EMC in most cases, the above two observations led the author to question whether present standards and test methods are completely necessary to provide for EMC, or whether it might be important to consider radio CE susceptibility by modes when specifying control of conducted emissions. Tools exist to separate modes. Topetto, Nave and Paul realized that filter design to meet CE limits is optimized by designing to separately control each emission mode. Since compliance measurement techniques do not provide mode-specific CE data, attempts were made to invent circuits which can provide this information. Nave invented both differential and common mode rejection networks (DMRN/CMRN) and marketed them under the trade names LISNMATE/LISNMARK, respectively. Each network attenuates the unwanted mode by 50 dB.
Original CE control was based on radio and television local oscillator emanations as
well as induction cooking ranges operating in the AM radio band. These were the only
sources of AM band rf energy, hence CE control was imposed only on these products. Such
control was exerted via use of two 5 µH LISNs, inserted in phase and neutral conductors,
with ground reference. Frequency range extended from 300 kHz to 30 MHz.
In the late 1970s, a new source of rfi appeared: office/information technology equipment
which utilized electrical switching techniques. Fourier spectra of such switching extended
into radio bands. The Computer and Business Equipment Manufacturers’ Association
(CBEMA) initiated a program to quantify and recommend solutions. Results were documented
in the CBEMA ESC5 report.
Victim radios were powered through a common impedance with culprit emitters (office/information technology equipment) and thresholds of interference (TOI) were established. These thresholds of interference were massaged into limits. Figure 6 shows the test set-up used to determine susceptibility of radio receivers to CW and pulsed CE. Victims were a selection of AM radios bought at typical consumer outlets. Common source impedance chosen was the traditional 5 µH LISN. Culprits were simulated by CW and pulse generators of 50 W source impedance, driving adjustable signal levels into the LISN port. TOIs thus determined were the basis for FCC limits.
Figure 6: Limit determination for office equipment CE
In contrast to the TOI measurement technique, CBEMA recommended CE measurement techniques similar to the earlier Part 18 CE test set-up. The CBEMA report recommends a compliance technique utilizing a 50 µH, 50 W LISN in each current carrying power conductor. The report explicitly addresses the effect on radio TOI due to a second source of CE available when power bus configuration supplies an above-ground neutral. The CBEMA report assumes that the conducted voltage at which TOI occurs would decrease 6 dB, due to twice the amount of CE available with this measurement technique1.
This last assumption was studied and is challenged by the author. It appears reasonable as long as the second source of rfi is held to be identical to the first. Equation set 1 models the CBEMA assumption.
TOI single LISN (dBmV) ~ Vmeasured Eq. 1-1
TOI two LISN (dBmV) ~ ˝. Vmeasured Eq. 1-2
However, the two-LISN technique measures two different types of CE, cm and dm. What is measured at each LISN port is a linear combination of these two noise components. An accurate mathematical analogy is that cm and dm noise components are two basis sets which together span the space of measurable line-to-ground CE. Equation set 2 models the author’s assumption.
LISN 1 (dBmV) ~ (Vcm + Vdm) Eq. 2-1
LISN 2 (dBmV) ~ (Vcm + Vdm) Eq. 2-2
TOI author’s model (dBmV) ~ (aVcm + bVdm) Eq. 2-3
With the model of 2-3, the CBEMA assumption is only valid if a » b. If this is not the case, as the author suspected, then it makes sense to control CE by modes, with the degree of strictness proportional to the ratio of a to b (i.e., cm to dm susceptibility).
Over 30 radios were tested. They varied greatly in price, performance, and purpose. What all 30 radios had in common were a linear power supply and a two wire (phase and neutral, no green or safety wire) ac power input. These two common characteristics impact performance (vis a vis power line rf noise) as follows.
Linear power supplies draw 60 Hz and/or 120 Hz current waveform. Since ac power source impedance is very low, there is no need to provide local dm low impedance energy storage, as for an SMPS. Filtering consists of enough capacity on power supply secondary to prevent objectionable 60/120 Hz ripple from entering audio stage. This type of filtering can be performed with electrolytics, which are poor filters at radio frequencies. Inspection of the tested radios revealed not a single case of rfi-specific filtering.
Lack of a case ground obviates any attempt at line-to-ground filtering — which is effective against cm CE. This single factor is the clue that radios might be expected to be more susceptible to cm than dm CE. Although dm filtering is only that residual level obtained fortuitously from ripple filters, it at least exists.
These comments are not a condemnation of present practices. In particular, cm filtering would be problematical even with a case ground. Some radios utilize their power cord as an FM antenna rather than provide a collapsible rod or antenna port (alarm clock types). Effective filtering of AM band rfi while passing FM signals is not economical in such inexpensive devices.
A full report (see References) describes a well- controlled test, including test set-up
and procedures for empirically determining the ![]() ratio. This portion is only
summarized briefly herein. The last part of the full report demonstrates benefits
resulting from CE control by modes.
ratio. This portion is only
summarized briefly herein. The last part of the full report demonstrates benefits
resulting from CE control by modes.
TOI is measured under controlled conditions, with noise injection mode the only variation. Several parameters are controlled to assure test validity. Parameters requiring control and control implementation, as well as detailed test procedures, are described in the referenced report. Figure 7 is a schematic of the test set-up. A device dubbed SMIN (selectable mode noise injection network) generated pure cm and dm signals. It consisted of a Y-splitter and transformer, with a switch changing the sense of the transformer windings. This device provided over 46 dB of alternate mode rejection in the AM band.

Figure 7: Radio TOI determination test set-up
Figure 8 portrays raw TOI measurements for all radios tested. A fairly consistent differential is evident between cm and dm TOI. In general, cm TOI is slightly below CBEMA TOI2. The Figure 8 data supports the study conclusion but is not overly instructive. A normalization is enlightening. Original CBEMA ESC5 testing likely resulted in a similar scatter plot, but a single limit of 48 dBµV was derived.3 If the Figure 8 CBEMA test results are normalized to 48 dBµV, and a normalization factor for each radio is then applied to both cm and dm TOI, Figure 9 emerges. Scatter reduction in Figure 9 allows for mode-unique limit setting by statistical methods. Figure 9 is rather busy; Figure 10 shows statistically derived means and standard deviations vs. FCC/CISPR limits as a function of frequency in the AM band.4 Figure 10 demonstrates two important conclusions. First, dm CE limits can be easily set near 70 dBµV, a relaxation of 22/14 dB relative to FCC/CISPR Class B limits, respectively. Also, not only is there more than a 20 dB difference between mean cm and dm TOI, but there exists more than a 10 dB difference between one standard deviation below the dm mean, and one standard deviation above the cm mean. Mode-specific TOI differences are statistically significant.
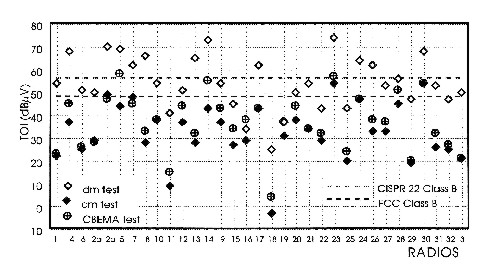
Figure 8: TOI of AM radios with broadcast reception at 10 dB ![]()
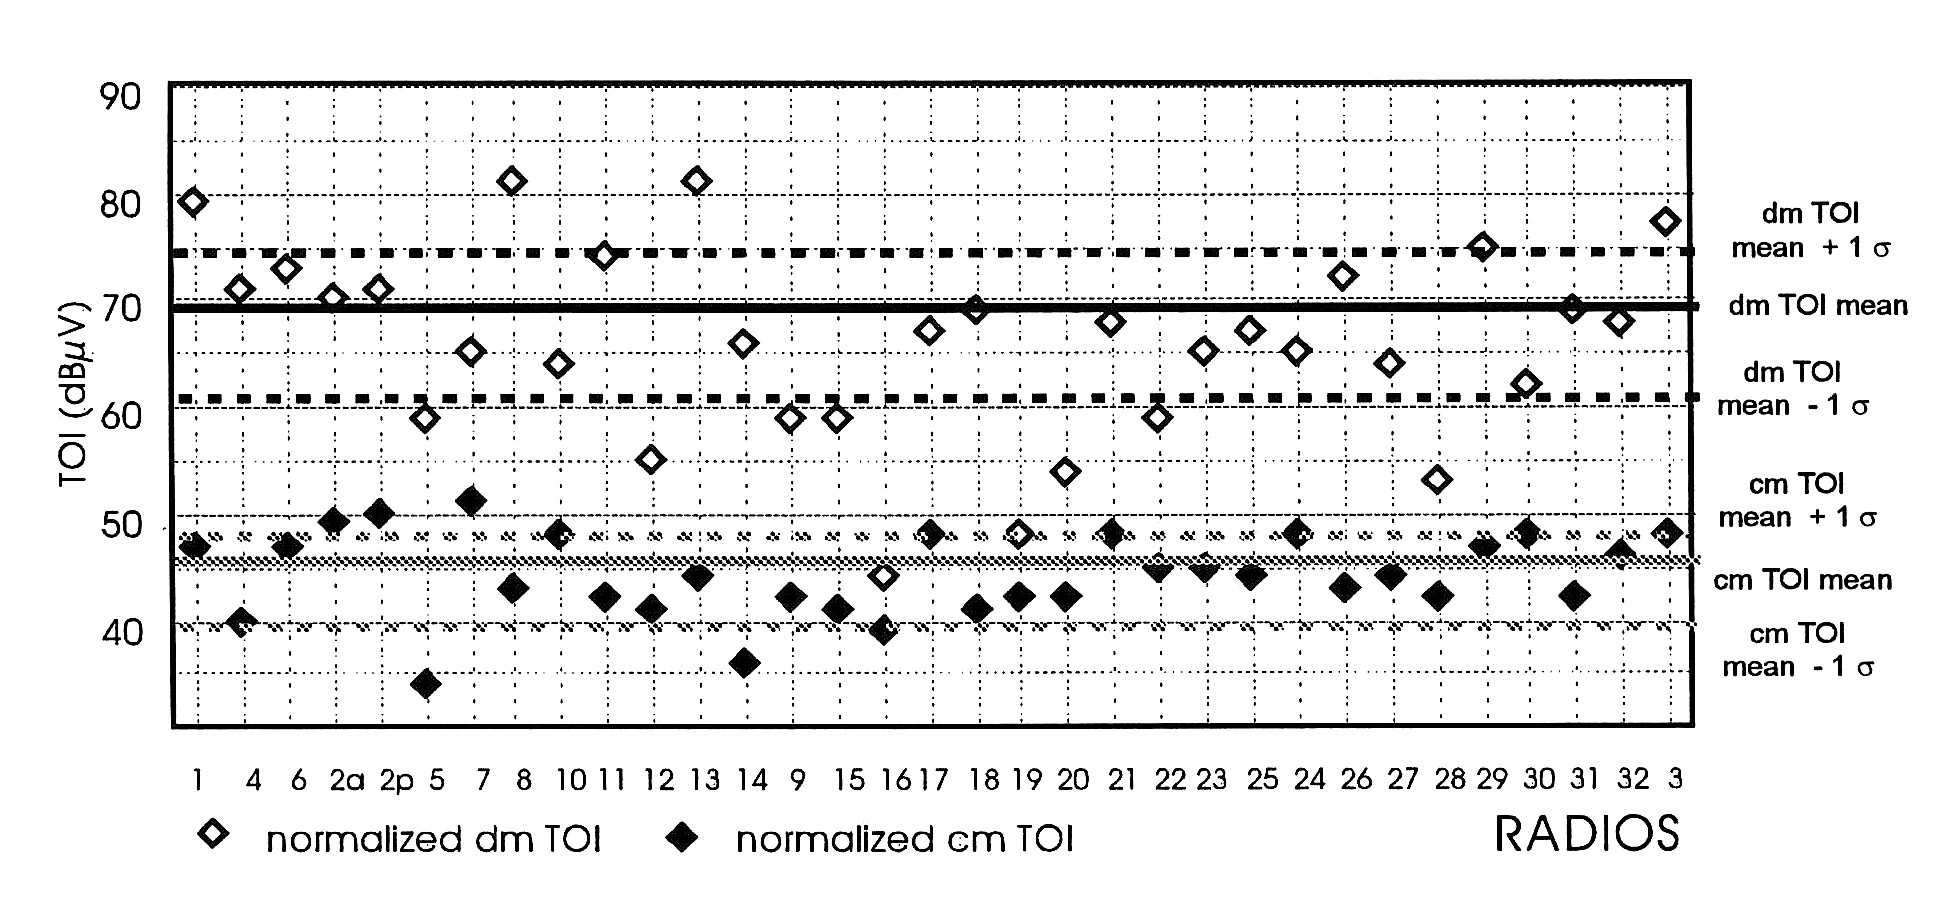
Figure 9: TOIs of Figure 8 with CBEMA TOI normalized to 48 dBµV
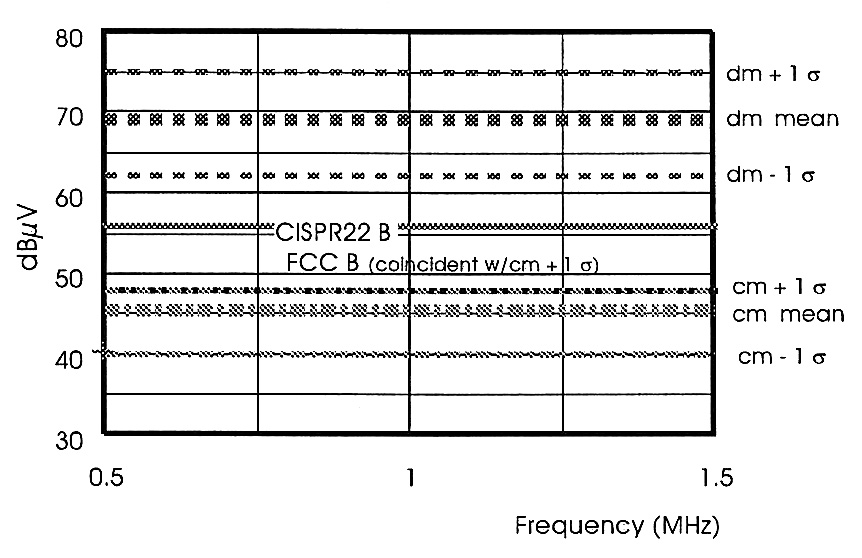
Figure 10: Statistical means/standard deviations vs. commercial CE limits
The above analysis compares measured CBEMA TOI and uses individual differences from 48 dBµV to adjust cm and dm TOI. This raises questions of linearity of TOI with changes in broadcast/rfi level. Testing demonstrated a high degree of linearity (see Figures 11 and 12) over a 50 dB change in radio input signal level.
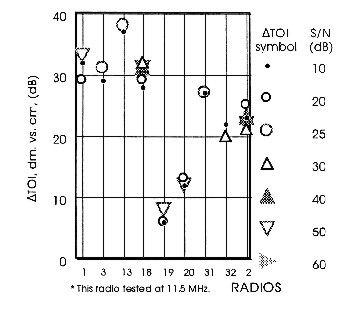
Figure 11: CM/DM TOI ratio linearity vs. received signal strength
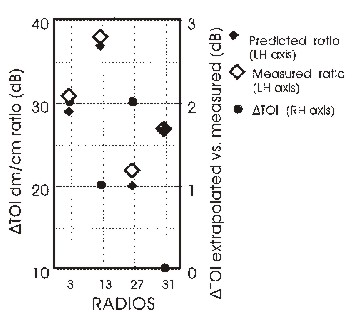
Figure 12: Predicted vs. measured dm/cm DTOI
Another factor requiring control as a source of error is any effect on TOI due to tuned frequency. Most, but not all radios in Figure 8 were tested at a mid-band frequency near 1 MHz. To quantify the effect, if any, of tuned frequency on TOI, several radios had their (cm and dm) TOIs measured at three frequencies, low-, mid-, high-band (Figure 13). Effect of tuned frequency is random, and does not affect test validity or conclusion.
Figure 13: Cm/dm DTOI variation vs. radio tuned frequency
Testing using a broadband noise source (low repetition pulsed) showed the same 20 dB disparity in response to dm vs. cm power-line conducted noise.
As stated in the introductory paragraphs, present day CE control has proved sufficient to protect AM band receivers. The issue raised in this article is whether present CE control is totally necessary. Results presented in Section 3 argue for relaxation of dm CE limits, while maintaining cm control at levels presently levied by the FCC. However, the value of such “tinkering” with present limits and methods of control has yet to be demonstrated. Admittedly, new mode-specific CE control complicates compliance testing; a payoff in less costly filter design must more than offset this complication.
It is more complicated and expensive to filter dm emissions than cm for an off-line supply. Therefore, if for cost reduction purposes one were to pick a single CE mode for limit relaxation, the mode selected would be differential. Fortunately, in preceding sections, it is precisely that mode’s limit which was found suitable for relaxation.
It has been estimated that on a global scale, the PC industry could save $35 million annually by relaxing the dm limit to 68 dBµV, while maintaining the cm limit at the present 48 dBµV5.
Response of over thirty radio receivers to power-line conducted noise was evaluated as to their susceptibility to common and differential mode noise.
Radios are much more susceptible to common mode than to differential mode noise. 20 dB differences between these responses strongly suggest the efficacy of procedures and limits which separately control cm and dm conducted emissions.
This work suggests that new standards be adopted which reflect real radio rfi susceptibility. Such regulatory action would decrease the cost of EMC compliance, with benefits resulting to both electronics manufacturers and consumers.
The author expresses gratitude to the following engineers for their invaluable assistance: Mr. Mark Nave of EMC Services designed the selectable mode rejection network (SMIN) per the author’s specification. The SMIN was at the very heart of the test method. Mr. Nave also offered many helpful suggestions over the course of the study. Mr. Charles Grasso of Storage-Tek and Mr. Vincent Greb of EMC Integrity provided insight into rf filter design cost factors. Mr. Duane Driver assisted with test fixture design/build and in running radio TOI tests.
Javor, Ken. “Investigation Into the Susceptibility of Radio Receivers to Power-Line Conducted Noise” EMC Compliance, P.O. Box 14161, Huntsville, AL, 1998.
 Ken Javor is founder of EMC Compliance in Huntsville,
AL, and author of “Introduction to the Control of
Electromagnetic Interference, A Guide to Understanding,
Applying, and Tailoring EMI Limits and Test Methods”
(1993). He can be reached during working hours at Sverdrup
Technology, Inc., (256) 971-9527.
His e-mail address is ken.javor@hsv.sverdrup.com.
1 CBEMA, 1977, ESC5 Report, paragraph 5.6.2, p. 5-24, 5-25
2 CBEMA TOI is that measured per the original CBEMA investigation, using one LISN.
3 Author’s conjecture; CBEMA ESC5 report does not include such test data.
4 One (European model) radio operating below 530kHz was tested. Its LW band performance
was identical to its MW performance, which was comparable with other radios tested.
5 This is an unofficial estimate by a major U. S. PC manufacturer.